
6.3: Naming and Definitions
- Page ID
- 93662
\( \newcommand{\vecs}[1]{\overset { \scriptstyle \rightharpoonup} {\mathbf{#1}} } \)
\( \newcommand{\vecd}[1]{\overset{-\!-\!\rightharpoonup}{\vphantom{a}\smash {#1}}} \)
\( \newcommand{\dsum}{\displaystyle\sum\limits} \)
\( \newcommand{\dint}{\displaystyle\int\limits} \)
\( \newcommand{\dlim}{\displaystyle\lim\limits} \)
\( \newcommand{\id}{\mathrm{id}}\) \( \newcommand{\Span}{\mathrm{span}}\)
( \newcommand{\kernel}{\mathrm{null}\,}\) \( \newcommand{\range}{\mathrm{range}\,}\)
\( \newcommand{\RealPart}{\mathrm{Re}}\) \( \newcommand{\ImaginaryPart}{\mathrm{Im}}\)
\( \newcommand{\Argument}{\mathrm{Arg}}\) \( \newcommand{\norm}[1]{\| #1 \|}\)
\( \newcommand{\inner}[2]{\langle #1, #2 \rangle}\)
\( \newcommand{\Span}{\mathrm{span}}\)
\( \newcommand{\id}{\mathrm{id}}\)
\( \newcommand{\Span}{\mathrm{span}}\)
\( \newcommand{\kernel}{\mathrm{null}\,}\)
\( \newcommand{\range}{\mathrm{range}\,}\)
\( \newcommand{\RealPart}{\mathrm{Re}}\)
\( \newcommand{\ImaginaryPart}{\mathrm{Im}}\)
\( \newcommand{\Argument}{\mathrm{Arg}}\)
\( \newcommand{\norm}[1]{\| #1 \|}\)
\( \newcommand{\inner}[2]{\langle #1, #2 \rangle}\)
\( \newcommand{\Span}{\mathrm{span}}\) \( \newcommand{\AA}{\unicode[.8,0]{x212B}}\)
\( \newcommand{\vectorA}[1]{\vec{#1}} % arrow\)
\( \newcommand{\vectorAt}[1]{\vec{\text{#1}}} % arrow\)
\( \newcommand{\vectorB}[1]{\overset { \scriptstyle \rightharpoonup} {\mathbf{#1}} } \)
\( \newcommand{\vectorC}[1]{\textbf{#1}} \)
\( \newcommand{\vectorD}[1]{\overrightarrow{#1}} \)
\( \newcommand{\vectorDt}[1]{\overrightarrow{\text{#1}}} \)
\( \newcommand{\vectE}[1]{\overset{-\!-\!\rightharpoonup}{\vphantom{a}\smash{\mathbf {#1}}}} \)
\( \newcommand{\vecs}[1]{\overset { \scriptstyle \rightharpoonup} {\mathbf{#1}} } \)
\(\newcommand{\longvect}{\overrightarrow}\)
\( \newcommand{\vecd}[1]{\overset{-\!-\!\rightharpoonup}{\vphantom{a}\smash {#1}}} \)
\(\newcommand{\avec}{\mathbf a}\) \(\newcommand{\bvec}{\mathbf b}\) \(\newcommand{\cvec}{\mathbf c}\) \(\newcommand{\dvec}{\mathbf d}\) \(\newcommand{\dtil}{\widetilde{\mathbf d}}\) \(\newcommand{\evec}{\mathbf e}\) \(\newcommand{\fvec}{\mathbf f}\) \(\newcommand{\nvec}{\mathbf n}\) \(\newcommand{\pvec}{\mathbf p}\) \(\newcommand{\qvec}{\mathbf q}\) \(\newcommand{\svec}{\mathbf s}\) \(\newcommand{\tvec}{\mathbf t}\) \(\newcommand{\uvec}{\mathbf u}\) \(\newcommand{\vvec}{\mathbf v}\) \(\newcommand{\wvec}{\mathbf w}\) \(\newcommand{\xvec}{\mathbf x}\) \(\newcommand{\yvec}{\mathbf y}\) \(\newcommand{\zvec}{\mathbf z}\) \(\newcommand{\rvec}{\mathbf r}\) \(\newcommand{\mvec}{\mathbf m}\) \(\newcommand{\zerovec}{\mathbf 0}\) \(\newcommand{\onevec}{\mathbf 1}\) \(\newcommand{\real}{\mathbb R}\) \(\newcommand{\twovec}[2]{\left[\begin{array}{r}#1 \\ #2 \end{array}\right]}\) \(\newcommand{\ctwovec}[2]{\left[\begin{array}{c}#1 \\ #2 \end{array}\right]}\) \(\newcommand{\threevec}[3]{\left[\begin{array}{r}#1 \\ #2 \\ #3 \end{array}\right]}\) \(\newcommand{\cthreevec}[3]{\left[\begin{array}{c}#1 \\ #2 \\ #3 \end{array}\right]}\) \(\newcommand{\fourvec}[4]{\left[\begin{array}{r}#1 \\ #2 \\ #3 \\ #4 \end{array}\right]}\) \(\newcommand{\cfourvec}[4]{\left[\begin{array}{c}#1 \\ #2 \\ #3 \\ #4 \end{array}\right]}\) \(\newcommand{\fivevec}[5]{\left[\begin{array}{r}#1 \\ #2 \\ #3 \\ #4 \\ #5 \\ \end{array}\right]}\) \(\newcommand{\cfivevec}[5]{\left[\begin{array}{c}#1 \\ #2 \\ #3 \\ #4 \\ #5 \\ \end{array}\right]}\) \(\newcommand{\mattwo}[4]{\left[\begin{array}{rr}#1 \amp #2 \\ #3 \amp #4 \\ \end{array}\right]}\) \(\newcommand{\laspan}[1]{\text{Span}\{#1\}}\) \(\newcommand{\bcal}{\cal B}\) \(\newcommand{\ccal}{\cal C}\) \(\newcommand{\scal}{\cal S}\) \(\newcommand{\wcal}{\cal W}\) \(\newcommand{\ecal}{\cal E}\) \(\newcommand{\coords}[2]{\left\{#1\right\}_{#2}}\) \(\newcommand{\gray}[1]{\color{gray}{#1}}\) \(\newcommand{\lgray}[1]{\color{lightgray}{#1}}\) \(\newcommand{\rank}{\operatorname{rank}}\) \(\newcommand{\row}{\text{Row}}\) \(\newcommand{\col}{\text{Col}}\) \(\renewcommand{\row}{\text{Row}}\) \(\newcommand{\nul}{\text{Nul}}\) \(\newcommand{\var}{\text{Var}}\) \(\newcommand{\corr}{\text{corr}}\) \(\newcommand{\len}[1]{\left|#1\right|}\) \(\newcommand{\bbar}{\overline{\bvec}}\) \(\newcommand{\bhat}{\widehat{\bvec}}\) \(\newcommand{\bperp}{\bvec^\perp}\) \(\newcommand{\xhat}{\widehat{\xvec}}\) \(\newcommand{\vhat}{\widehat{\vvec}}\) \(\newcommand{\uhat}{\widehat{\uvec}}\) \(\newcommand{\what}{\widehat{\wvec}}\) \(\newcommand{\Sighat}{\widehat{\Sigma}}\) \(\newcommand{\lt}{<}\) \(\newcommand{\gt}{>}\) \(\newcommand{\amp}{&}\) \(\definecolor{fillinmathshade}{gray}{0.9}\)Now that we have covered what an ER diagram is, let’s go into more detail regarding the finer points of data modeling. ER diagrams are used to visually represent data relationships in many settings, but they are most commonly used in business environments. These data representations allow many companies to better use their resources and make well-informed decisions.

These diagrams should be easily representable and understandable by a wide majority of employees, as they represent data and/or inner functions of the company. Therefore, it is obvious that such diagrams must be easily readable and functional to allow quick decision-making.
Speaking of readability, in these ER diagrams, naming values and objects is half the battle. Something that shares this need is programming, as creating variables and methods with explanatory yet short names helps to increase readability of the code. Understanding this, writing ER diagrams brings many similar concepts, so writing an ER diagram is nearly the same as writing the code that drives it. The value of self-explanatory variable names cannot be understated, as they help keep the company and its employees informed. However, explaining such concepts without an example is needlessly abstract, so let’s start by making a few tables and bringing them up to snuff.

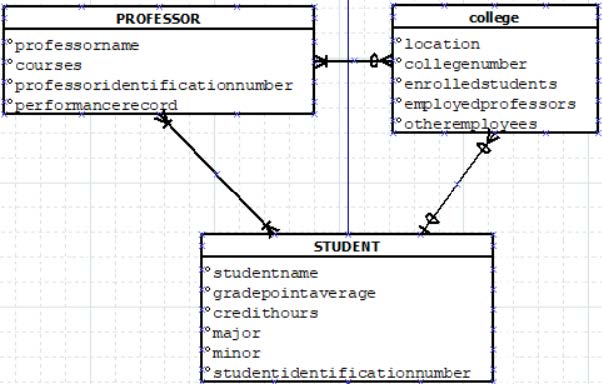
Now with these tables, we can start to fix problems, but first let’s start with some baselines. Firstly, we can see an empty value in table \(\PageIndex{1}\), and with no relations, table names, or variable names these tables do not convey any meaningful information. Choosing an example set of data, we can display the relationship between a Student, a College, and their Professors.

Now this table is still far from ideal. Tables share variables, and these names are terrible, and would require a large amount of explanation to make sense. Let’s start fixing it step by step. Our first objective will be getting the data to a more readable state. The variable names currently in the table are atrociously low on elaboration or are so general that anything could fit where they are. Other variables are even repeated, so if they were used as a unique identifier or a primary key the program would give irrelevant or hindering information. This would lead to many problems, both in coding and in viewing. Let’s make some edits to the table to better represent the variables that are in there right now.
Now that the variables have been clarified, we can begin fixing some finer details like the relations between each table. The student and college relation is not indicative of the general format. A student at college will only have one college, and a college will have far more than one student enrolled. Additionally, professors that teach generally tend to stay at one college, so changing that correlation will better fit the represented data. Fixing this will better clarify the tables’ reliance on each other, as well as opening more relation options between them.
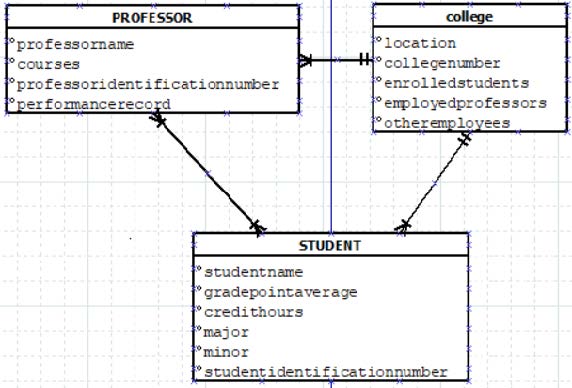
Now with the inter-table relations fixed, our focus can shift to the formatting of variables and table names. Some variables have far too long a name to be practically used or understood. Be careful when fixing these names, however, as cutting off too much or using unorthodox acronyms can lead to the same confusion regarding the variables. Also, no one wants to read super long variable names, and doing so in a conference or meeting puts an unnecessarily large amount of time spent explaining what a simple diagram should be.
In programming, such variables would never be used, mainly because no one wants to type out student identification nnumber, and then find out they misspelled it. Additionally, such values are memory inefficient, wasting space that could be used to make processes run faster. So, now to fix the table, look for shorter variable names or acronyms to replace the names already there, but remember, going for shortness over functionality could lead to a similarly cryptic graph.
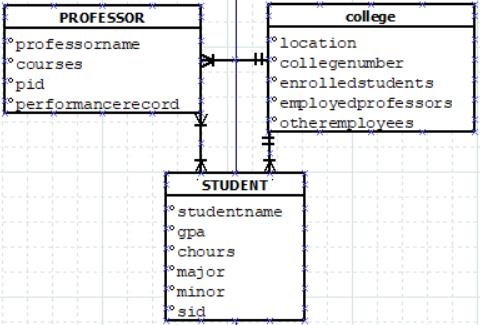
Now that these variable names are much shorter, let’s format them more professionally. Capitalization is an easy way to better present data in a professional way. Capitalizing acronyms and oneword variables is one more layer to add to the credibility of the relation. Additionally, we can format variables in a better way than just a long string of characters. There are many naming conventions common in programming that can be applied outside of code to ER diagrams, but for this example, we will use the Camel case convention. Camel case uses capital letters after the first word to increase readability of longer variable names (ex: numapplepie to numApplePie).

This table has come a long way, and now that it is properly formatted, let’s focus on details like the primary key for each table. For formatting, the primary key should go at the top of the table variables to better represent its role. Adding to the layers of complexity, let’s examine some of the variables and their use. What about student names? Attempting to separate the name down into 2-3 parts is a tactic that is required, as most universities and colleges order role via last name.
So let’s add some clarification to that name. Remember if we apply some convention to the visual, it should carry through, so if we edit studentName, we must edit the professorName variable as well. Another topic to cover is sub tables, that is tables that elaborate on certain variables within another linked table. In the next example, we will add the dependent variable to the Professor table as well as a sub table. One other topic to cover is useless data. Look at the college table and see that there are two employee variables. That’s a waste of both space and data, so they can be combined into one variable.

Now that all these edits have been applied, this table has been fixed from its confusing original state to one that could be shown to a conference room of businesspeople. All the changes were meant to improve both the appearance and readability of the data. Of course, some sacrifices were made to fit tables like these into this form. Ideally, an ER diagram should have a good bit of white space in between
the tables to better separate them from each other. But stepping away from the massive amount of refining we had to do, these should not be applied after the table was written, but during the process. This allows for less overall time spent making the table, and more time available to improve or enhance the model or programming behind it. But let’s step away from the complexity and formatting of these tables to better grasp the concept of modeling entities and their relationships.
When modeling new or different entities, it is best to approach the problem step by step. Start by splitting up the work into different categories: the initial entity, the attributes of that entity, and the entity’s relationships to other values. Applying this logic to a new table, let’s use a shipping company as an example. Firstly, let’s identify the company’s entities, which will be the tables necessary to understand its inner workings. Entities like orders and storage are very important, but there are far too many entities to model, so depending on what the meeting entails, tailoring the data to fit the occasion is a necessity. For instance, showing what customer data you get in a meeting discussing storage employee importance is unimportant to the current topic.
Speaking of customer data, the next step in making a comprehendible ER diagram revolves around getting the attributes and variables that each entity has. Remember to make this data easily recognizable by its name. That name should represent the data contained within, because while a variable named Ren_and_Stimpy is very recognizable, if it contained an order number, that would be terribly confusing. Customer data might include things like their name, address, and so forth. Customer data should, however, not include extraneous details like their sex or skin color. While elaborating on what each entity has, be careful not to program personal details to be stored carelessly, as data leaks have become more and more common over the years. Keeping the data secure is important, but remember, the less you collect, the easier it is to encrypt or protect from outside influence.