
7.1: Introduction
- Page ID
- 85111
\( \newcommand{\vecs}[1]{\overset { \scriptstyle \rightharpoonup} {\mathbf{#1}} } \)
\( \newcommand{\vecd}[1]{\overset{-\!-\!\rightharpoonup}{\vphantom{a}\smash {#1}}} \)
\( \newcommand{\dsum}{\displaystyle\sum\limits} \)
\( \newcommand{\dint}{\displaystyle\int\limits} \)
\( \newcommand{\dlim}{\displaystyle\lim\limits} \)
\( \newcommand{\id}{\mathrm{id}}\) \( \newcommand{\Span}{\mathrm{span}}\)
( \newcommand{\kernel}{\mathrm{null}\,}\) \( \newcommand{\range}{\mathrm{range}\,}\)
\( \newcommand{\RealPart}{\mathrm{Re}}\) \( \newcommand{\ImaginaryPart}{\mathrm{Im}}\)
\( \newcommand{\Argument}{\mathrm{Arg}}\) \( \newcommand{\norm}[1]{\| #1 \|}\)
\( \newcommand{\inner}[2]{\langle #1, #2 \rangle}\)
\( \newcommand{\Span}{\mathrm{span}}\)
\( \newcommand{\id}{\mathrm{id}}\)
\( \newcommand{\Span}{\mathrm{span}}\)
\( \newcommand{\kernel}{\mathrm{null}\,}\)
\( \newcommand{\range}{\mathrm{range}\,}\)
\( \newcommand{\RealPart}{\mathrm{Re}}\)
\( \newcommand{\ImaginaryPart}{\mathrm{Im}}\)
\( \newcommand{\Argument}{\mathrm{Arg}}\)
\( \newcommand{\norm}[1]{\| #1 \|}\)
\( \newcommand{\inner}[2]{\langle #1, #2 \rangle}\)
\( \newcommand{\Span}{\mathrm{span}}\) \( \newcommand{\AA}{\unicode[.8,0]{x212B}}\)
\( \newcommand{\vectorA}[1]{\vec{#1}} % arrow\)
\( \newcommand{\vectorAt}[1]{\vec{\text{#1}}} % arrow\)
\( \newcommand{\vectorB}[1]{\overset { \scriptstyle \rightharpoonup} {\mathbf{#1}} } \)
\( \newcommand{\vectorC}[1]{\textbf{#1}} \)
\( \newcommand{\vectorD}[1]{\overrightarrow{#1}} \)
\( \newcommand{\vectorDt}[1]{\overrightarrow{\text{#1}}} \)
\( \newcommand{\vectE}[1]{\overset{-\!-\!\rightharpoonup}{\vphantom{a}\smash{\mathbf {#1}}}} \)
\( \newcommand{\vecs}[1]{\overset { \scriptstyle \rightharpoonup} {\mathbf{#1}} } \)
\(\newcommand{\longvect}{\overrightarrow}\)
\( \newcommand{\vecd}[1]{\overset{-\!-\!\rightharpoonup}{\vphantom{a}\smash {#1}}} \)
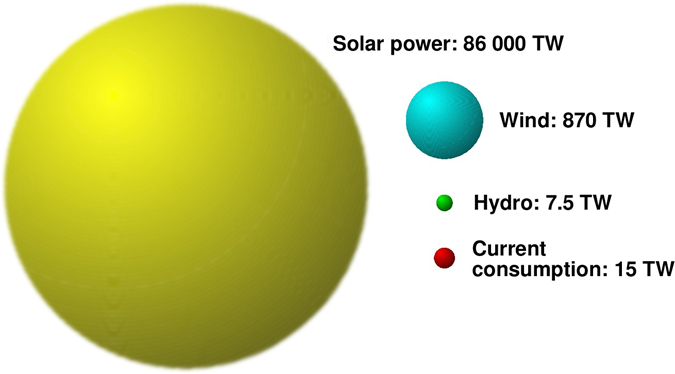
\(\newcommand{\avec}{\mathbf a}\) \(\newcommand{\bvec}{\mathbf b}\) \(\newcommand{\cvec}{\mathbf c}\) \(\newcommand{\dvec}{\mathbf d}\) \(\newcommand{\dtil}{\widetilde{\mathbf d}}\) \(\newcommand{\evec}{\mathbf e}\) \(\newcommand{\fvec}{\mathbf f}\) \(\newcommand{\nvec}{\mathbf n}\) \(\newcommand{\pvec}{\mathbf p}\) \(\newcommand{\qvec}{\mathbf q}\) \(\newcommand{\svec}{\mathbf s}\) \(\newcommand{\tvec}{\mathbf t}\) \(\newcommand{\uvec}{\mathbf u}\) \(\newcommand{\vvec}{\mathbf v}\) \(\newcommand{\wvec}{\mathbf w}\) \(\newcommand{\xvec}{\mathbf x}\) \(\newcommand{\yvec}{\mathbf y}\) \(\newcommand{\zvec}{\mathbf z}\) \(\newcommand{\rvec}{\mathbf r}\) \(\newcommand{\mvec}{\mathbf m}\) \(\newcommand{\zerovec}{\mathbf 0}\) \(\newcommand{\onevec}{\mathbf 1}\) \(\newcommand{\real}{\mathbb R}\) \(\newcommand{\twovec}[2]{\left[\begin{array}{r}#1 \\ #2 \end{array}\right]}\) \(\newcommand{\ctwovec}[2]{\left[\begin{array}{c}#1 \\ #2 \end{array}\right]}\) \(\newcommand{\threevec}[3]{\left[\begin{array}{r}#1 \\ #2 \\ #3 \end{array}\right]}\) \(\newcommand{\cthreevec}[3]{\left[\begin{array}{c}#1 \\ #2 \\ #3 \end{array}\right]}\) \(\newcommand{\fourvec}[4]{\left[\begin{array}{r}#1 \\ #2 \\ #3 \\ #4 \end{array}\right]}\) \(\newcommand{\cfourvec}[4]{\left[\begin{array}{c}#1 \\ #2 \\ #3 \\ #4 \end{array}\right]}\) \(\newcommand{\fivevec}[5]{\left[\begin{array}{r}#1 \\ #2 \\ #3 \\ #4 \\ #5 \\ \end{array}\right]}\) \(\newcommand{\cfivevec}[5]{\left[\begin{array}{c}#1 \\ #2 \\ #3 \\ #4 \\ #5 \\ \end{array}\right]}\) \(\newcommand{\mattwo}[4]{\left[\begin{array}{rr}#1 \amp #2 \\ #3 \amp #4 \\ \end{array}\right]}\) \(\newcommand{\laspan}[1]{\text{Span}\{#1\}}\) \(\newcommand{\bcal}{\cal B}\) \(\newcommand{\ccal}{\cal C}\) \(\newcommand{\scal}{\cal S}\) \(\newcommand{\wcal}{\cal W}\) \(\newcommand{\ecal}{\cal E}\) \(\newcommand{\coords}[2]{\left\{#1\right\}_{#2}}\) \(\newcommand{\gray}[1]{\color{gray}{#1}}\) \(\newcommand{\lgray}[1]{\color{lightgray}{#1}}\) \(\newcommand{\rank}{\operatorname{rank}}\) \(\newcommand{\row}{\text{Row}}\) \(\newcommand{\col}{\text{Col}}\) \(\renewcommand{\row}{\text{Row}}\) \(\newcommand{\nul}{\text{Nul}}\) \(\newcommand{\var}{\text{Var}}\) \(\newcommand{\corr}{\text{corr}}\) \(\newcommand{\len}[1]{\left|#1\right|}\) \(\newcommand{\bbar}{\overline{\bvec}}\) \(\newcommand{\bhat}{\widehat{\bvec}}\) \(\newcommand{\bperp}{\bvec^\perp}\) \(\newcommand{\xhat}{\widehat{\xvec}}\) \(\newcommand{\vhat}{\widehat{\vvec}}\) \(\newcommand{\uhat}{\widehat{\uvec}}\) \(\newcommand{\what}{\widehat{\wvec}}\) \(\newcommand{\Sighat}{\widehat{\Sigma}}\) \(\newcommand{\lt}{<}\) \(\newcommand{\gt}{>}\) \(\newcommand{\amp}{&}\) \(\definecolor{fillinmathshade}{gray}{0.9}\)Direct solar power – the solar radiation arriving directly from Sun – is the “greenest” of all energy sources, one that dwarfs all other available energy sources combined (including those who are “transformed” forms of solar energy).
Some important definitions: Solar Constant , or the Total Solar Irradiance (TSI)
- the total power of solar electromagnetic radiation that falls on a unit surface area at a vertical angle above the Earth atmosphere, at a distance of 1 astronomic unit1 from the Sun. It’s value is \( s= 1.3615\; kW/m^[2} \) it’s the average value over a 11-year solar cycle, with an amplitude of about 0.1%, and short-period fluctuations – see the TSI variation graph for the years 1980-90).
Knowing the TSI value, one can calculate the total solar power \( P_{tot} \) reaching the top of the Earth’a atmosphere. The average Earth’s radius is \( R=6371\; km\). But from the Author’s 10 year perspective of teaching the Energy Alternatives course it follows that the task is not “100% conceptually clear”.
** A Digression: the Instructor’s Adventure with \( P_{tot} \) ** Every year the above task was given as a classroom test, together with a “hint”: The surface area of a sphere is \( 4 \pi R_{2} \), and the surface area of a disc (one side) is \( \pi R^{2} \). Which formula shall you multiply by the TSI value to get the right value?. The answers showed that the problem was not conceptually clear for many students. Few students chose the \( 4 \pi R^{2} \) formula, but a surprisingly large number of them insisted that one should take \( 2 \pi R^{2} \). When asked why, they usually gave an explanation like this: \( 4 \pi R^{2} \) is not the correct formula, because it’s the entire surface area – but only one-half of the Earth’s surface is illuminated by Sun, there is night on the other half, so the right formula to take is \( 2 \pi R^{2} \).
The Author tried to explain why that was wrong: Look, he persuaded, the TSI definition talks about the radiation that falls on a unit surface area at a vertical angle. But this is not the case for all Earth, the radiation arrives from one direction only, so for most spots on Earth it does not fall at a vertical angle!. So, the students reluctantly agreed that indeed, \( 2 \pi R^{2} \) would not be the right formula – but such conclusion, regretfully, did not bring them any closer to the right formula.
Not surprising! Because if the radiation impinges a unit area not at right angle, but at an angle \( \theta \lt 90_{\circ} \) , than the power that falls on this area is not TSI, but \( TSI * sin \theta \). And if a parallel beam of radiation falls on a sphere, then the \( \theta \) angle is different for different spots on the sphere’s surface... How should one deal with such a problem?
The students were right. For calculating the total power impinging the illuminated side of a sphere one would need to take into account the \( \theta \)angle and perform an integration over the illuminated part, which would not be a trivial task. Not too many students taking the Energy Alternatives course have enough background in calculus for setting up and solving the integral needed.
But the integral is not necessary! The instructor’s fault was to give an “insufficient hint”. A good hint would be like this: suppose that you have magic powers, and you want to block all sunlight coming to Earth by placing a gigantic black disc in front of it. What is the radius of the disc you would need, and how much solar power it would absorb?
Now the problem is easy! To block all sunlight from Earth, you need to put a disc of radius \( R=6371\; km\) in front of the planet, on the path of the incoming sunlight and perpendicular to the rays. So, the power deposited now on the disc is \( TSI \pi R^{2} \). And this is the solar power blocked from reaching Earth. So, if we remove the disc, the power deposited on Earth would be the same, \( P_{tot} = TSI \pi R^{2} \). And if we now insert the numbers, we get:
\[ P_{tot} =1361.5 \; W/m^{2} \times \pi \times (6, 371, 000 m)^{2} = 1.736 \times 10^{17}\;W = 174 \;PW \]
** End of the Digression. **
Insolation. \(TSI = 1361.5 W/m^{2} \) only at the top of the Earth’s atmosphere. Of the arriving 174 PW of power, only about 89 PW reaches the Earth’s surface. In Fig. \(\PageIndex{3}\) it is shown what is weakening the power when sunlight travels through the atmosphere. First of all, some radiation (about 10 PW) is back-reflected by the atmosphere, and even more by the clouds (about 35 PW – that much is back-reflected from the clouds in the famous picture of Earth taken by the Apollo 17 crew in 1972.
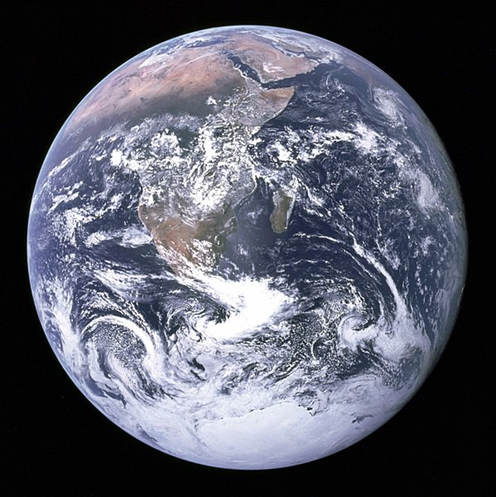
One can see the white clouds, and the whole photograph is bluish in color. It comes from the fact that the efficiency of “back-reflecting” and scattering light by atmospheric gases depends on the light color: for visible radiation, the effect is the strongest for for the shortest wavelengths, i.e., for the color blue2. In the same photo, near the top one can also see what’s undoubtedly the contour of Africa. The color of the landmass is brownish
– Earth’s surface also back-reflects some impinging sunlight (about 7 PW), and the back-reflected color obviously depends on whether the light reflected from water surface or from a landmass. And a big portion (some 33 PW) of the impinging radiation is simply absorbed by the atmosphere.
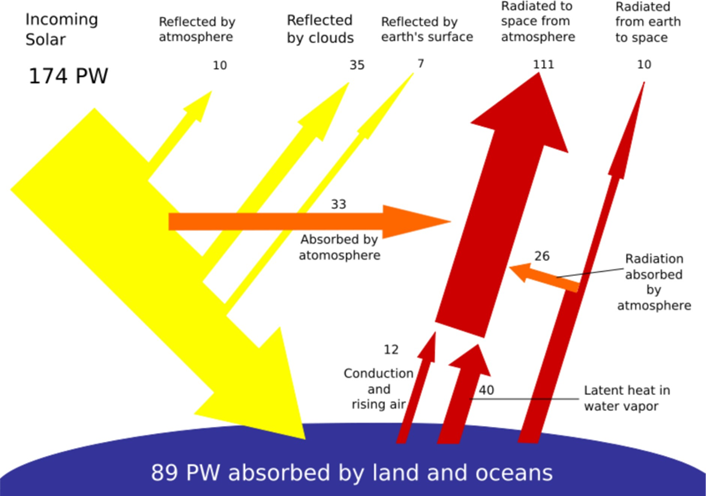
So, effectively, of the impinging 174 PW only about 89 PW reaches the Earth surface and is therefore available for being converted for other forms of power by humans. It means that the “effective TSI value” at the Earth surface on a sunny day may be between 0.8 and 1.0 \(kW/m^{2} \), depending on the geographic location. This brings us to the notion of insolation.
Insolation (not to be confused with insulation, or with shoe insoles ): a measure of solar radiation energy received on a given surface area in a given time. It is commonly expressed as a 24-hour average irradiance in Watts per square meter (\(W/m^{2} \)). Note: a square meter of actual terrain at a given location, not a square meter perpendicular to the incoming radiation, as in the definition of STI.
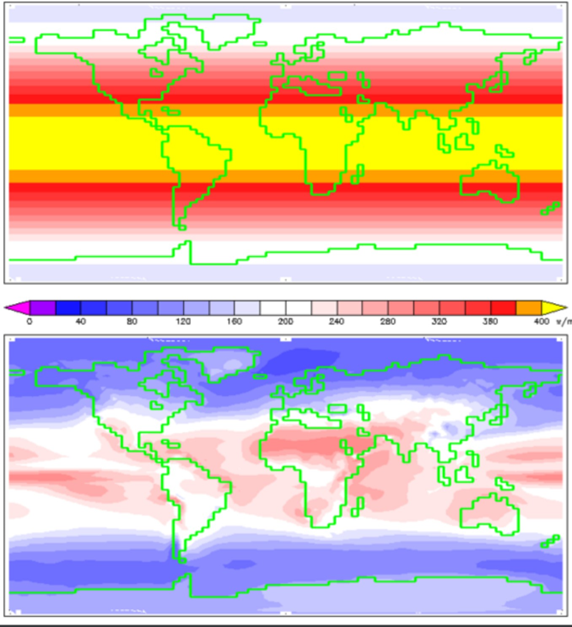
The geographic distribution of the insolation is shown in Fig. \(\PageIndex{4}\). At the top of the atmosphere the maximum insolation occurs in the equatorial regions, where the value, as indicated by the yellow color, may exceed \400 W/m^{2} \) 24h. It’s easy to understand where such number comes from. Consider a 1 m2 “imaginary unit surface area” (call it IUSA3) at the top of the atmosphere at it’s equatorial region. The atmosphere rotates together with our planet, so that for 12 hours IUSA is in darkness. Then, it crosses what astronomers call the terminator , which is the line that divides the daylit side and the dark night side of a planetary body. At this moment the solar rays fall on the IUSA at a \( \theta \) angle equal zero – and for the next six hours, \( \theta \) gradually increases, finally reaching \( \theta = 90_{\circ} \) when IUSA crosses the line drawn through the centers of Sun and Earth. And from that moment on, \( \theta \) keeps decreasing and falls to zero when IUSA again crosses the Terminator, now re-entering the dark night side of Earth.
And from that moment on, \( \theta \) keeps decreasing and falls to zero when IUSA again crosses the Terminator, now re-entering the dark night side of Earth.
The sunlight power deposited at a unit surface area, when it's not perpendicular to the incoming rays, is \(P=\sin \theta \cdot 1362 \mathrm{~W} / \mathrm{m}^{2}\). When \(\theta\) gradually changes from o to \(90^{\circ}\), or to \(\pi / 2\) in radians, \(\sin \theta\) increases from o to 1 , and the average value of the \(\sin \theta\) function is then:
\[ (\sin \theta)_{\text {aver. }}=\frac{\int_{0}^{\pi / 2} \sin \theta d \theta}{\pi / 2}=\frac{1}{\pi / 2}=2 / \pi=0.6366 \]
So, during the first 6-hour period the average power delivered to the IUSA is \(0.63661362 \mathrm{~W} / \mathrm{m}^{2}=867 \mathrm{~W} / \mathrm{m}^{2}\). For the next 6-hour period it's also 867 \(\mathrm{W} / \mathrm{m}^{2}\), and then, for the 12 nighttime hours, its zero. So, the average for a 24-hour period is \(867 / 2=433.5 \mathrm{~W} / \mathrm{m}^{2}\), which indeed agrees well withthe color-scale in Fig. 7.4.
If we put our IUSA not at the Equator, but more to the north or more to the south at a \(\Phi\) latitude, the \(433.5 \mathrm{~W} / \mathrm{m}^{2}\) insolation has to be additionally multiplied by \(\cos \Phi\). For instance, for Corvallis \(\Phi\) is close to \(45^{\circ}\) North, so that the insolation for an IUSA flying high over our city would be 434:0.7071 \(=307\) \(\mathrm{W} / \mathrm{m}^{2}\). More about calculating insolation at different latitudes can be found in a dedicated Wikipedia article.
In the solar power industry, they usually prefer to use not insolation, but solar irradiance instead, expressed not as the 24-hour average of sunlight power deposited to an area of a square meter, but as the total radiation energy deposited to such an area. The unit used then is \(\mathrm{kWh} / \mathrm{m}^{2}\). The conversion from insolation expressed in \(\mathrm{W} / \mathrm{m}^{2}\) to solar irradiance expressed in \(\mathrm{kWh} / \mathrm{m}^{2}\) is easy, one simply needs to multiply the former by 24 . For instance, the \(307 \mathrm{~W} / \mathrm{m}^{2}\) insolation result we have obtained for an IUSA flying high over Corvallis translates into a solar irradiance of \(307 \mathrm{~W} / \mathrm{m}^{2} \times 24\) \(\mathrm{h}=7368 \mathrm{Wh} / \mathrm{m}^{2}=7.37 \mathrm{kWh} / \mathrm{m}^{2}\).
But as far as the insolation at the ground level is considered, it may be much lower than that measured at the top of the atmosphere. For instance, for Corvallis the highest is in July: \(5.94 \mathrm{kWh} / \mathrm{m}^{2}\) day, which is \(5.94 / 7 \cdot 37\) \(=0.806=80.6 \%\) of the annual average at the top of the atmosphere. In December it's the lowest, \(1.00 \mathrm{kWh} / \mathrm{m}^{2}\) day, which is \(13.6 \%\) of that annual average. What's the reason of such a big difference? Everybody knows, the clouds! So, not only the geographic latitude is important, the number of sunshine hours in the region also matters.
There are 8766 hours in a year, daytime hours are slightly more than one half of that number (because of the size of the Sun disc – the daytime lasts from the moment the disc starts emerging from under the horizon, to the moment the disc completely disappears). In the sunniest regions of Earth, such as the Sahara Desert, there are more that 4000 sunshine hours in a year, which translates into average annual insolation of 6.3 kWh/m2/day. The map of average insolation in the USA is shown in Fig. \(\PageIndex{5}\).
____________________________________________________
1. An astronomical unit, a.u., is the average Earth-Sun distance, 149 597 871 kilometers.
2. For the same reason the setting sun is red – at the sunset, the light has to travel a long way through the atmosphere, so that most blue light is back-reflected and “ejected” from the beam of sunlight, while these effects are much weaker for the red light.
3. It’s a name created ad hoc by the Author, you’ll not find it in “official literature”.