17.12: Appendix L- The Properties of the 105 μm Sand
- Page ID
- 35285
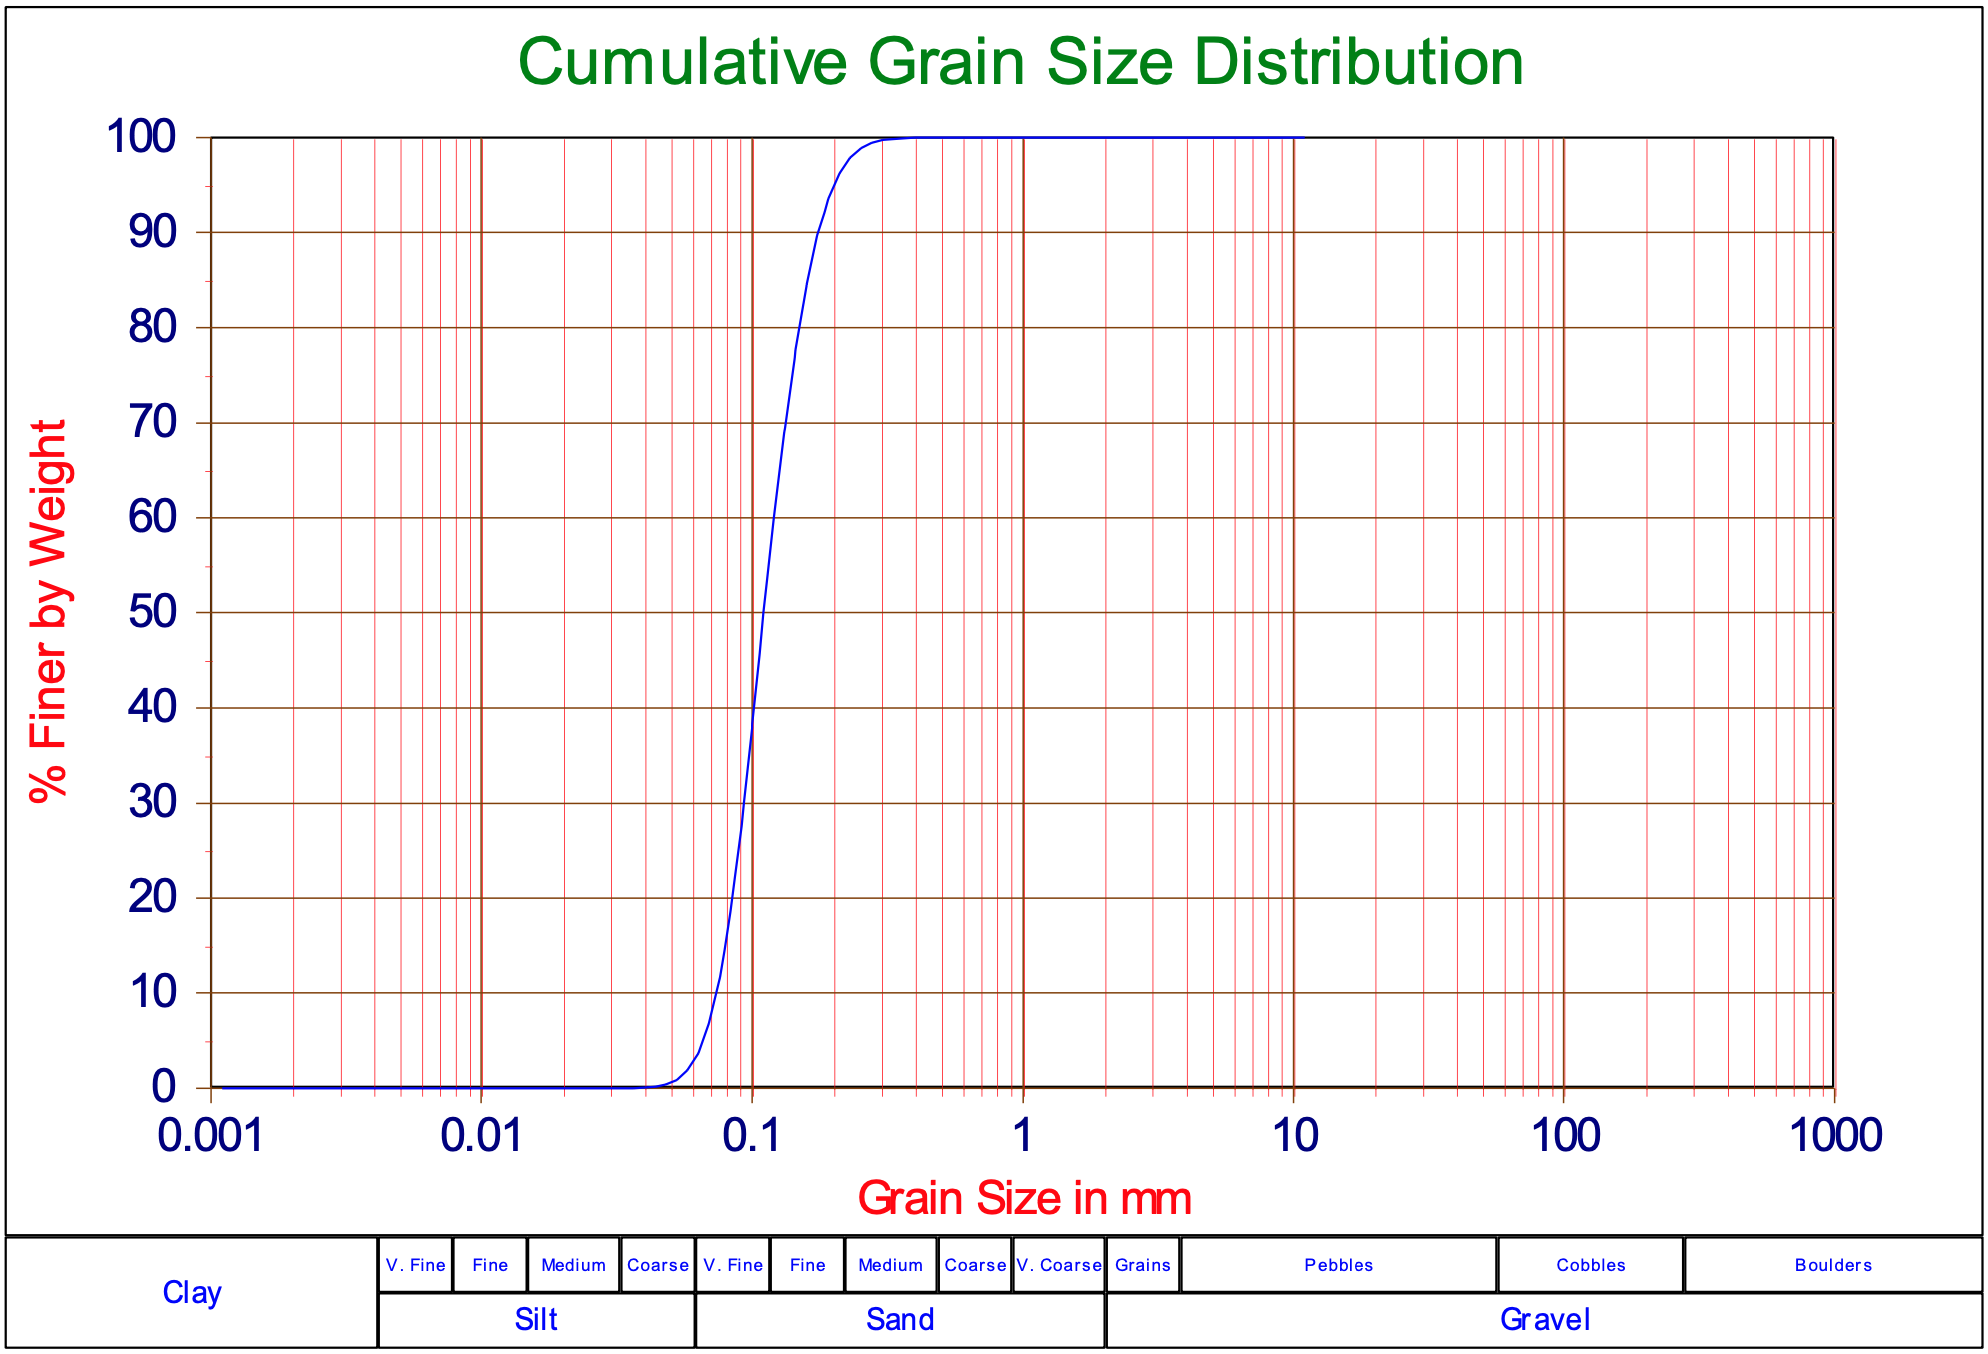
The sand in the new laboratory DE, with a d50 of 105 μm, is examined for the following soil mechanical parameters:
-
The minimum and the maximum density, Table L-1: Pore percentages, indicated are the average measured densities for the various blade angles.
-
The saturated critical density, Table L-1: Pore percentages, indicated are the average measured densities for the various blade angles.
-
The permeability as a function of the density, Table L-2: Permeabilities, indicated are the average permeabilities for the various blade angles.
-
The angle of internal friction as a function of the density, Table L-4: The angle of internal friction as a function of the pore percentage.
-
The d50 as a function of the time, Table L-3: The d50 of the sand as a function of time.
-
The cone resistance per test.
-
The density in the test stand in combination with the cone resistance.
The points 6 and 7 need some explanation. As with the 200 μm sand density measurements are performed in situ with the aid of a Troxler density measuring set. The calibration formula for the 105 μm sand is:
\[\ \mathrm{n=\frac{69.9}{C_{p}^{0.068}} \quad\text{ with: n in %, }C_{p}\text{ in kPa}}\tag{L-1}\]
In which the cone resistance is determined in a top layer of 12 cm, where the cone resistance was continuously increasing and almost proportional with the depth. The value to be used in this equation is the cone resistance for the 12 cm depth.
With the aid of this equation it was possible to determine the density for each cutting test from the cone resistance measurements. As, however, new sand was used, the density showed changed in time. The sand was looser in the first tests than in the last tests. This resulted in different average initial densities for the different test series. The tests with a 45o blade were performed first with an average pore percentage of 44.9%. The tests with the 60o blade were performed with an average pore percentage of 44.2%. The tests with the 30o blade were performed with an average pore percentage of 43.6%. Because of the consolidation of the sand a relatively large spread was found in the first tests.
Table L-2 lists the permeabilities corresponding to the mentioned pore percentages. By extrapolation in Table L-2 a permeability of 0.00017 m/s is derived for the maximum pore percentage of 51.6%.
The sand bed is flushed after the linear tests because of the visibility in the water above the sand. In the tables it is indicated which soil mechanical parameters are determined after the flushing of the sand bed.
|
Minimum density |
51.6% |
|
Maximum density |
38.3% |
|
Initial density 30 o |
43.6% |
|
Initial density 45 o |
44.9% |
|
Initial density 60 o |
44.2% |
|
After the flushing |
|
|
Minimum density |
50.6% |
|
Maximum density |
37.7% |
|
Saturated critical density |
44.5% |
|
Pore percentage |
Permeability (m/s) |
|
42.2% |
0.000051 |
|
45.6% |
0.000082 |
|
47.4% |
0.000096 |
|
49.4% |
0.000129 |
|
Initial |
|
|
43.6% |
0.000062 |
|
44.2% |
0.000067 |
|
44.9% |
0.000075 |
|
After the flushing |
|
|
39.6% |
0.000019 |
|
40.7% |
0.000021 |
|
41.8% |
0.000039 |
|
43.8% |
0.000063 |
|
45.7% |
0.000093 |
|
48.3% |
0.000128 |
|
Date |
d50 (mm) |
|
06-08-1986 |
0.102 |
|
06-08-1986 |
0.097 |
|
06-08-1986 |
0.104 |
|
06-08-1986 |
0.129 |
|
06-08-1986 |
0.125 |
|
06-08-1986 |
0.123 |
|
29-08-1986 |
0.105 |
|
29-08-1986 |
0.106 |
|
29-08-1986 |
0.102 |
|
16-09-1986 |
0.111 |
|
16-09-1986 |
0.105 |
|
16-09-1986 |
0.107 |
|
Pore percentage |
Cell pressure kPa |
Angle of internal friction |
|
Saturated undrained |
After the flushing |
|
|
44.7% |
100 |
33.5o |
|
44.9% |
200 |
33.3o |
|
44.5% |
400 |
32.8o |
|
42.6% |
100 |
35.0o |
|
42.1% |
200 |
35.5o |
|
42.2% |
400 |
34.8o |
|
39.8% |
100 |
38.6o |
|
39.9% |
200 |
38.3o |
|
39.6% |
400 |
37.9o |