
1.3: Activity 3 - Using pseudo-codes and flowcharts to represent algorithms
- Page ID
- 48196
Introduction
The student will learn how to design an algorithm using either a pseudo code or flowchart. Pseudo code is a mixture of English like statements, some mathematical notations and selected keywords from a programming language. It is one of the tools used to design and develop the solution to a task or problem. Pseudo codes have different ways of representing the same thing and emphasis is on the clarity and not style.
Pseudo Code
Pseudo code is an informal high-level description of the operating principle of a computer program or other algorithm. It is a procedure for solving a problem in terms of the actions to be executed and the order in which those actions are to be executed.
Pseudo code uses the structural conventions of a programming language, but is intended for human reading rather than machine reading. It typically omits details that are not essential for human understanding of the algorithm, such as variable declarations, system-specific code and some subroutines. The programming language is augmented with natural language description details, where convenient, or with compact mathematical notation.
The purpose of using pseudo code is that it is easier for people to understand than conventional programming language code, and that it is an efficient and environment-independent description of the key principles of an algorithm. It is commonly used in textbooks and scientific publications that are documenting various algorithms, and also in planning of computer program development, for sketching out the structure of the program before the actual coding takes place.
In the following example, the pseudo code is on program that can add 2 numbers together then display the result.
Solution
Start program
Enter two numbers A, B
Add the two numbers together
Print sum
End program
Flow Chart
A flow chart is a type of diagram that represents an algorithm, workflow or process. It shows the steps in the form of boxes of various kinds and their order by connecting them with arrows. The diagrammatic representation illustrates a solution model to a given problem.
Flowcharts can be used in the analysis, design, documenting or managing a process or program in various fields. They are also used in designing and documenting complex processes or programs.
Flowchart building blocks
- They are represented as circles, ovals or rounded (fillet) rectangles. They contain the word “Start” or “End”, or another phrase signaling the start or end of a process, such as “submit inquiry” or “receive product”.
- They show “flow of control”. For example an arrow coming from one symbol and ending at another symbol represents that control passes to the symbol the arrow points to. The line for the arrow can be solid or dashed. The meaning of the arrow with dashed line may differ from one flowchart to another and can be defined in the legend.
- These are represented as rectangles.
- Subroutines are represented as rectangles with double-struck vertical edges. They are used to show complex processing steps which may be detailed in a separate flowchart.
- These are represented as a parallelogram.
- These are represented as a hexagon. They normally show operations which have no effect other than preparing a value for a subsequent conditional or decision step (see below).
- These are normally represented as a diamond (rhombus) showing where a decision is necessary. They commonly test a Yes/No question or True/False condition. It has two arrows coming out of it, usually from the bottom point and right point, one corresponding to Yes or True, and one corresponding to No or False.
- It is generally represented with a black blob, showing where multiple control flows converge in a single exit flow. A junction symbol will have more than one arrow coming into it, but only one going out.
- They are represented by an identifying label inside a circle. Normally used in complex or multi-sheet diagrams to substitute for arrows. For each label, the “outflow” connector must always be unique, but there may be any number of “inflow” connectors. In this case, a junction in control flow is implied.
- It is normally represented by a double transverse line with any number of entry and exit arrows.They can be used whenever two or more control flows must operate simultaneously. The exit flows are activated concurrently when all of the entry flows have reached the concurrency symbol. A concurrency symbol with a single entry flow is a fork; one with a single exit flow is a join.
NB
All processes should flow from top to bottom and left to right.
Problem: Calculate and report the grade-point average for a class.
Discussion: The average grade equals the sum of all grades divided by the number of students.
- Output: Average grade
- Input: Student grades
- Processing: Find the sum of the grades; count the number of students; calculate average
PSEUDO CODE
Program: Determine the average grade of a class
Initialize Counter and Sum to 0
Do While there are more data
    Get the next Grade
    Add the Grade to the Sum
    Increment the Counter
Loop
Computer Average = Sum / Counter
Display Average
FLOW CHART
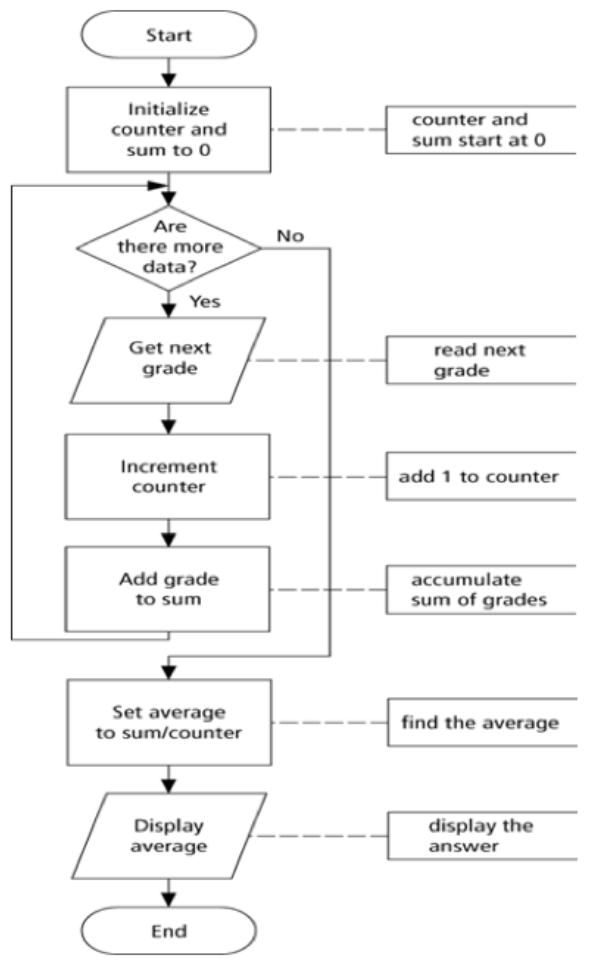
Figure \(\PageIndex{1}\): The Average Grade of a Class Flowchart
Conclusion
This section covered the algorithm development tools, that is, the pseudo codes, flowcharts and how to design and develop them. These tools are not hinged to any programming language but can be implemented in any language of choice. Basically these are the initial steps of designing a program for any given task. Examples for both are given to try and show the learner how they look like. On the flow charts, it has further included the building blocks of a flow chart.
- Give two important differences between the flowchart and the pseudocode.
- Give two examples of selection control structures. Use flowchart.
- Draw the different types of symbols used in the flowchart. Explain the role of each.