
5.10: Detail- Life Insurance
- Page ID
- 50965

An example of statistics and probability in everyday life is their use in life insurance. We consider here only one-year term insurance (insurance companies are very creative in marketing more complex policies that combine aspects of insurance, savings, investment, retirement income, and tax minimization).
When you take out a life insurance policy, you pay a premium of so many dollars and, if you die during the year, your beneficiaries are paid a much larger amount. Life insurance can be thought of in many ways.
From a gambler’s perspective, you are betting that you will die and the insurance company is betting that you will live. Each of you can estimate the probability that you will die, and because probabilities are subjective, they may differ enough to make such a bet seem favorable to both parties (for example, suppose you know about a threatening medical situation and do not disclose it to the insurance company). Insurance companies use mortality tables such as Table 5.2 (shown also in Figure 5.4) for setting their rates. (Interestingly, insurance companies also sell annuities, which from a gambler’s perspective are bets the other way around—the company is betting that you will die soon, and you are betting that you will live a long time.)
Another way of thinking about life insurance is as a financial investment. Since insurance companies on average pay out less than they collect (otherwise they would go bankrupt), investors would normally do better investing their money in another way, for example by putting it in a bank.
Most people who buy life insurance, of course, do not regard it as either a bet or an investment, but rather as a safety net. They know that if they die, their income will cease and they want to provide a partial replacement for their dependents, usually children and spouses. The premium is small because the probability of death is low during the years when such a safety net is important, but the benefit in the unlikely case of death may be very important to the beneficiaries. Such a safety net may not be as important to very rich people (who can afford the loss of income), single people without dependents, or older people whose children have grown up.
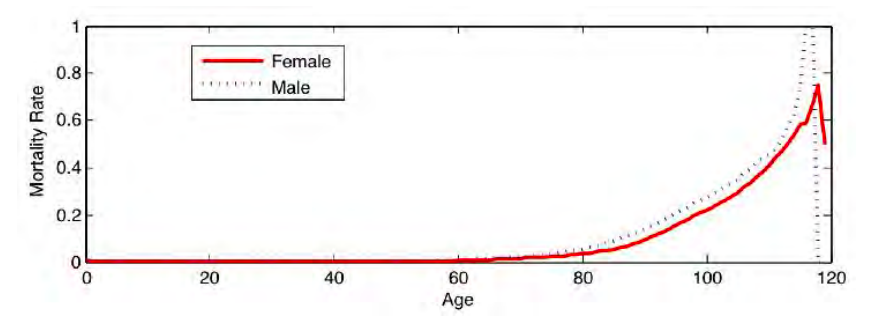
Figure 5.4 and Table 5.2 show the probability of death during one year, as a function of age, for the cohort of U. S. residents born in 1988 (data from The Berkeley Mortality Database\(^2\)).
| Age | Female | Male | Age | Female | Male | Age | Female | Male |
|
0 |
0.008969 | 0.011126 | 40 | 0.000945 | 0.002205 | 80 | 0.035107 | 0.055995 |
| 1 | 0.000727 | 0.000809 | 41 | 0.001007 | 0.002305 | 81 | 0.038323 | 0.061479 |
| 2 | 0.000384 | 0.000526 | 42 | 0.00107 | 0.002395 | 82 | 0.041973 | 0.067728 |
| 3 | 0.000323 | 0.000415 | 43 | 0.001144 | 0.002465 | 83 | 0.046087 | 0.074872 |
| 4 | 0.000222 | 0.000304 | 44 | 0.001238 | 0.002524 | 84 | 0.050745 | 0.082817 |
| 5 | 0.000212 | 0.000274 | 45 | 0.001343 | 0.002605 | 85 | 0.056048 | 0.091428 |
| 6 | 0.000182 | 0.000253 | 46 | 0.001469 | 0.002709 | 86 | 0.062068 | 0.100533 |
| 7 | 0.000162 | 0.000233 | 47 | 0.001616 | 0.002856 | 87 | 0.06888 | 0.110117 |
| 8 | 0.000172 | 0.000213 | 48 | 0.001785 | 0.003047 | 88 | 0.076551 | 0.120177 |
| 9 | 0.000152 | 0.000162 | 49 | 0.001975 | 0.003295 | 89 | 0.085096 | 0.130677 |
| 10 | 0.000142 | 0.000132 | 50 | 0.002198 | 0.003566 | 90 | 0.094583 | 0.141746 |
| 11 | 0.000142 | 0.000132 | 51 | 0.002454 | 0.003895 | 91 | 0.105042 | 0.153466 |
| 12 | 0.000162 | 0.000203 | 52 | 0.002743 | 0.004239 | 92 | 0.116464 | 0.165847 |
| 13 | 0.000202 | 0.000355 | 53 | 0.003055 | 0.00463 | 93 | 0.128961 | 0.179017 |
| 14 | 0.000263 | 0.000559 | 54 | 0.003402 | 0.00505 | 94 | 0.142521 | 0.193042 |
| 15 | 0.000324 | 0.000793 | 55 | 0.003795 | 0.005553 | 95 | 0.156269 | 0.207063 |
| 16 | 0.000395 | 0.001007 | 56 | 0.004245 | 0.006132 | 96 | 0.169964 | 0.221088 |
| 17 | 0.000426 | 0.001161 | 57 | 0.004701 | 0.006733 | 97 | 0.183378 | 0.234885 |
| 18 | 0.000436 | 0.001254 | 58 | 0.005153 | 0.007357 | 98 | 0.196114 | 0.248308 |
| 19 | 0.000426 | 0.001276 | 59 | 0.005644 | 0.008028 | 99 | 0.208034 | 0.261145 |
| 20 | 0.000406 | 0.001288 | 60 | 0.006133 | 0.008728 | 100 | 0.220629 | 0.274626 |
| 21 | 0.000386 | 0.00131 | 61 | 0.006706 | 0.009549 | 101 | 0.234167 | 0.289075 |
| 22 | 0.000386 | 0.001312 | 62 | 0.007479 | 0.010629 | 102 | 0.248567 | 0.304011 |
| 23 | 0.000396 | 0.001293 | 63 | 0.008491 | 0.012065 | 103 | 0.263996 | 0.319538 |
| 24 | 0.000417 | 0.001274 | 64 | 0.009686 | 0.013769 | 104 | 0.280461 | 0.337802 |
| 25 | 0.000447 | 0.001245 | 65 | 0.011028 | 0.015702 | 105 | 0.298313 | 0.354839 |
| 26 | 0.000468 | 0.001226 | 66 | 0.012368 | 0.017649 | 106 | 0.317585 | 0.375342 |
| 27 | 0.000488 | 0.001237 | 67 | 0.013559 | 0.019403 | 107 | 0.337284 | 0.395161 |
| 28 | 0.000519 | 0.001301 | 68 | 0.014525 | 0.020813 | 108 | 0.359638 | 0.420732 |
| 29 | 0.00055 | 0.001406 | 69 | 0.015363 | 0.022053 | 109 | 0.383459 | 0.439252 |
| 30 | 0.000581 | 0.001532 | 70 | 0.016237 | 0.023393 | 110 | 0.408964 | 0.455882 |
| 31 | 0.000612 | 0.001649 | 71 | 0.017299 | 0.025054 | 111 | 0.437768 | 0.47619 |
| 32 | 0.000643 | 0.001735 | 72 | 0.018526 | 0.027029 | 112 | 0.466216 | 0.52 |
| 33 | 0.000674 | 0.00179 | 73 | 0.019972 | 0.029387 | 113 | 0.494505 | 0.571429 |
| 34 | 0.000705 | 0.001824 | 74 | 0.02163 | 0.032149 | 114 | 0.537037 | 0.625 |
| 35 | 0.000747 | 0.001859 | 75 | 0.023551 | 0.035267 | 115 | 0.580645 | 0.75 |
| 36 | 0.000788 | 0.001904 | 76 | 0.02564 | 0.038735 | 116 | 0.588235 | 1 |
| 37 | 0.00083 | 0.001961 | 77 | 0.027809 | 0.042502 | 117 | 0.666667 | 1 |
| 38 | 0.000861 | 0.002028 | 78 | 0.030011 | 0.046592 | 118 | 0.75 | 0 |
| 39 | 0.000903 | 0.002105 | 79 | 0.032378 | 0.051093 | 119 | 0.5 | 0 |
\(^2\)The Berkeley Mortality Database can be accessed online: http://www.demog.berkeley.edu/ bmd/states.html