23.2: Investigation
- Page ID
- 30304

\( \newcommand{\vecs}[1]{\overset { \scriptstyle \rightharpoonup} {\mathbf{#1}} } \)
\( \newcommand{\vecd}[1]{\overset{-\!-\!\rightharpoonup}{\vphantom{a}\smash {#1}}} \)
\( \newcommand{\id}{\mathrm{id}}\) \( \newcommand{\Span}{\mathrm{span}}\)
( \newcommand{\kernel}{\mathrm{null}\,}\) \( \newcommand{\range}{\mathrm{range}\,}\)
\( \newcommand{\RealPart}{\mathrm{Re}}\) \( \newcommand{\ImaginaryPart}{\mathrm{Im}}\)
\( \newcommand{\Argument}{\mathrm{Arg}}\) \( \newcommand{\norm}[1]{\| #1 \|}\)
\( \newcommand{\inner}[2]{\langle #1, #2 \rangle}\)
\( \newcommand{\Span}{\mathrm{span}}\)
\( \newcommand{\id}{\mathrm{id}}\)
\( \newcommand{\Span}{\mathrm{span}}\)
\( \newcommand{\kernel}{\mathrm{null}\,}\)
\( \newcommand{\range}{\mathrm{range}\,}\)
\( \newcommand{\RealPart}{\mathrm{Re}}\)
\( \newcommand{\ImaginaryPart}{\mathrm{Im}}\)
\( \newcommand{\Argument}{\mathrm{Arg}}\)
\( \newcommand{\norm}[1]{\| #1 \|}\)
\( \newcommand{\inner}[2]{\langle #1, #2 \rangle}\)
\( \newcommand{\Span}{\mathrm{span}}\) \( \newcommand{\AA}{\unicode[.8,0]{x212B}}\)
\( \newcommand{\vectorA}[1]{\vec{#1}} % arrow\)
\( \newcommand{\vectorAt}[1]{\vec{\text{#1}}} % arrow\)
\( \newcommand{\vectorB}[1]{\overset { \scriptstyle \rightharpoonup} {\mathbf{#1}} } \)
\( \newcommand{\vectorC}[1]{\textbf{#1}} \)
\( \newcommand{\vectorD}[1]{\overrightarrow{#1}} \)
\( \newcommand{\vectorDt}[1]{\overrightarrow{\text{#1}}} \)
\( \newcommand{\vectE}[1]{\overset{-\!-\!\rightharpoonup}{\vphantom{a}\smash{\mathbf {#1}}}} \)
\( \newcommand{\vecs}[1]{\overset { \scriptstyle \rightharpoonup} {\mathbf{#1}} } \)
\( \newcommand{\vecd}[1]{\overset{-\!-\!\rightharpoonup}{\vphantom{a}\smash {#1}}} \)
\(\newcommand{\avec}{\mathbf a}\) \(\newcommand{\bvec}{\mathbf b}\) \(\newcommand{\cvec}{\mathbf c}\) \(\newcommand{\dvec}{\mathbf d}\) \(\newcommand{\dtil}{\widetilde{\mathbf d}}\) \(\newcommand{\evec}{\mathbf e}\) \(\newcommand{\fvec}{\mathbf f}\) \(\newcommand{\nvec}{\mathbf n}\) \(\newcommand{\pvec}{\mathbf p}\) \(\newcommand{\qvec}{\mathbf q}\) \(\newcommand{\svec}{\mathbf s}\) \(\newcommand{\tvec}{\mathbf t}\) \(\newcommand{\uvec}{\mathbf u}\) \(\newcommand{\vvec}{\mathbf v}\) \(\newcommand{\wvec}{\mathbf w}\) \(\newcommand{\xvec}{\mathbf x}\) \(\newcommand{\yvec}{\mathbf y}\) \(\newcommand{\zvec}{\mathbf z}\) \(\newcommand{\rvec}{\mathbf r}\) \(\newcommand{\mvec}{\mathbf m}\) \(\newcommand{\zerovec}{\mathbf 0}\) \(\newcommand{\onevec}{\mathbf 1}\) \(\newcommand{\real}{\mathbb R}\) \(\newcommand{\twovec}[2]{\left[\begin{array}{r}#1 \\ #2 \end{array}\right]}\) \(\newcommand{\ctwovec}[2]{\left[\begin{array}{c}#1 \\ #2 \end{array}\right]}\) \(\newcommand{\threevec}[3]{\left[\begin{array}{r}#1 \\ #2 \\ #3 \end{array}\right]}\) \(\newcommand{\cthreevec}[3]{\left[\begin{array}{c}#1 \\ #2 \\ #3 \end{array}\right]}\) \(\newcommand{\fourvec}[4]{\left[\begin{array}{r}#1 \\ #2 \\ #3 \\ #4 \end{array}\right]}\) \(\newcommand{\cfourvec}[4]{\left[\begin{array}{c}#1 \\ #2 \\ #3 \\ #4 \end{array}\right]}\) \(\newcommand{\fivevec}[5]{\left[\begin{array}{r}#1 \\ #2 \\ #3 \\ #4 \\ #5 \\ \end{array}\right]}\) \(\newcommand{\cfivevec}[5]{\left[\begin{array}{c}#1 \\ #2 \\ #3 \\ #4 \\ #5 \\ \end{array}\right]}\) \(\newcommand{\mattwo}[4]{\left[\begin{array}{rr}#1 \amp #2 \\ #3 \amp #4 \\ \end{array}\right]}\) \(\newcommand{\laspan}[1]{\text{Span}\{#1\}}\) \(\newcommand{\bcal}{\cal B}\) \(\newcommand{\ccal}{\cal C}\) \(\newcommand{\scal}{\cal S}\) \(\newcommand{\wcal}{\cal W}\) \(\newcommand{\ecal}{\cal E}\) \(\newcommand{\coords}[2]{\left\{#1\right\}_{#2}}\) \(\newcommand{\gray}[1]{\color{gray}{#1}}\) \(\newcommand{\lgray}[1]{\color{lightgray}{#1}}\) \(\newcommand{\rank}{\operatorname{rank}}\) \(\newcommand{\row}{\text{Row}}\) \(\newcommand{\col}{\text{Col}}\) \(\renewcommand{\row}{\text{Row}}\) \(\newcommand{\nul}{\text{Nul}}\) \(\newcommand{\var}{\text{Var}}\) \(\newcommand{\corr}{\text{corr}}\) \(\newcommand{\len}[1]{\left|#1\right|}\) \(\newcommand{\bbar}{\overline{\bvec}}\) \(\newcommand{\bhat}{\widehat{\bvec}}\) \(\newcommand{\bperp}{\bvec^\perp}\) \(\newcommand{\xhat}{\widehat{\xvec}}\) \(\newcommand{\vhat}{\widehat{\vvec}}\) \(\newcommand{\uhat}{\widehat{\uvec}}\) \(\newcommand{\what}{\widehat{\wvec}}\) \(\newcommand{\Sighat}{\widehat{\Sigma}}\) \(\newcommand{\lt}{<}\) \(\newcommand{\gt}{>}\) \(\newcommand{\amp}{&}\) \(\definecolor{fillinmathshade}{gray}{0.9}\)Activity A – History of global energy consumption and production
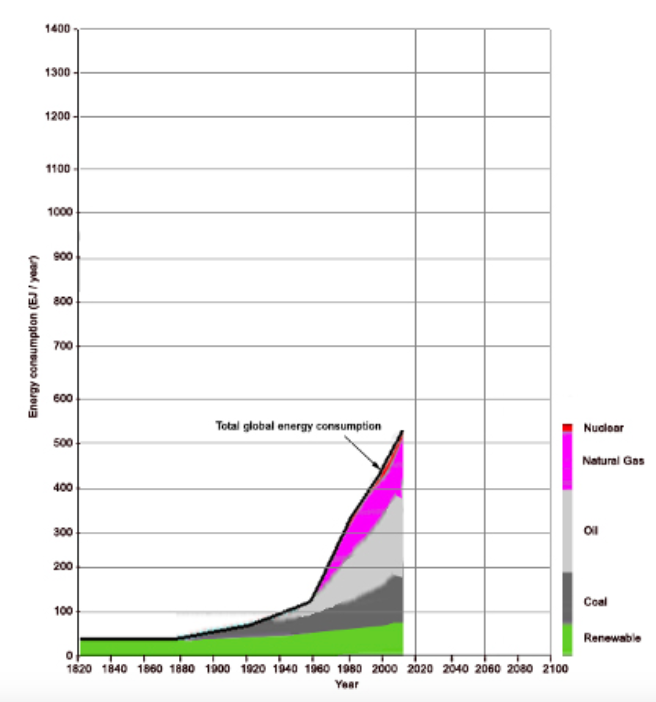
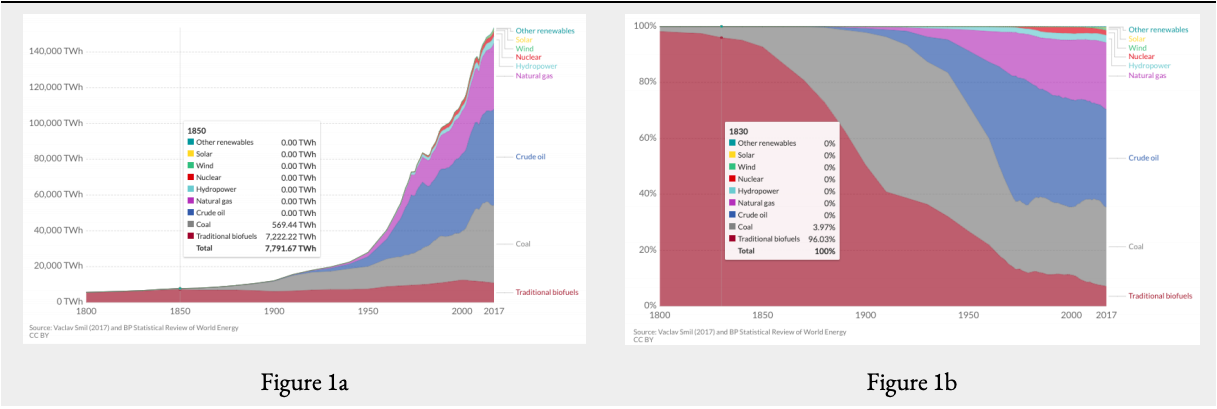
Begin this activity by launching the interactive graph of global primary energy consumption from Our World in Data <https://ourworldindata.org/grapher/global-primary-energy>. Use this tool to determine the total energy consumed and the percentage of that energy provided by the sources listed in Table 23.2.1 on the following page for selected years between 1800 and 2017. Record your results in Table 23.2.1. Then use your results to answer the questions following the table.
A terawatt hour is a unit of energy equal to outputting 1 trillion watts for one hour. As a point of reference, this is the equivalent of the amount of energy consumed by one billion average toasters operating for an hour
| 1800 | 1850 | 1900 | 1940 | 1994 | 2015 | 2017 | |
| Total energy consumed |
| Percentage of total energy provided by the following fuels |
| Traditional biofuels | |||||||
| Coal | |||||||
| Crude Oil | |||||||
| Natural gas | |||||||
| Nuclear | |||||||
| Hydropower | |||||||
| Wind | |||||||
| Solar | |||||||
| Other renewables |
Table \(\PageIndex{1}\): Worksheet for recording results of Part A
Questions - Historical energy productions and consumption
- When did the “fossil fuel age” begin? Fossil fuels include coal, oil, and natural gas.
- When does nuclear appear in the energy mix?
- When does hydropower appear in the energy mix?
- When does wind, solar, and other renewables appear in the mix?
- How has the percentage of the total energy provided by each of these fuel groups changed since they first appeared?
Activity B: Global energypresent
Begin Part B by accessing the world energy flow chart produced by Lawrence Livermore National Laboratory’s Flow Charts project <flowcharts.llnl.gov/content/assests/images/charts/Energy/ENERGY_2011_World.png>
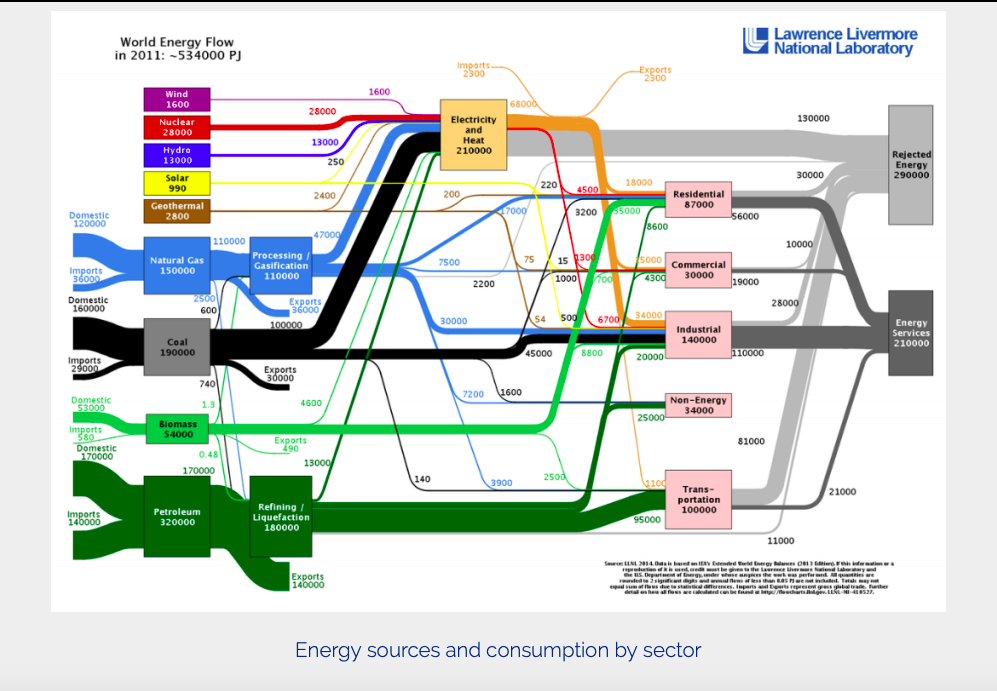
The two boxes on the right edge of the graph show how much of the energy consumed does useful work (energy services) vs. how much is simply released to the environment as heat (rejected energy). The lines connecting the various boxes represent energy flow between sources and consuming sectors.
The energy units in this graph are petajoules (PJ). One petajoule is 0.3 terawatt hours.
Questions - Present energy production and consumption
- What is the overall energy efficiency of global consumption? How do the four sectors on the right side of the diagram compare in terms of energy consumption and efficiency? The box non-energy is excluded from these sectors. Eenergy efficiency (SEE) is calculated this way EE=Energy consumed by a sector that does useful work Total Energy consumed by that sector
- What percentage of the world’s total energy production is converted into electricity?
- What is the efficiency of the world’s electric power generation?
Part C – Global energy 2100
In Part C you will be designing a global energy mix for the year 2100 that will keep the increase in annual mean global temperature (MGT) in the year 2100 to less than 2.0°C. To do so you will be using the climate / energy simulator En-Roads.
To begin part C, launch EN-ROADS <https://en-roads.climateinteractive.org/scenario.html?v=2.7.19>. Figure 23.2.3 shows what you should see after EN-ROADS has launched.
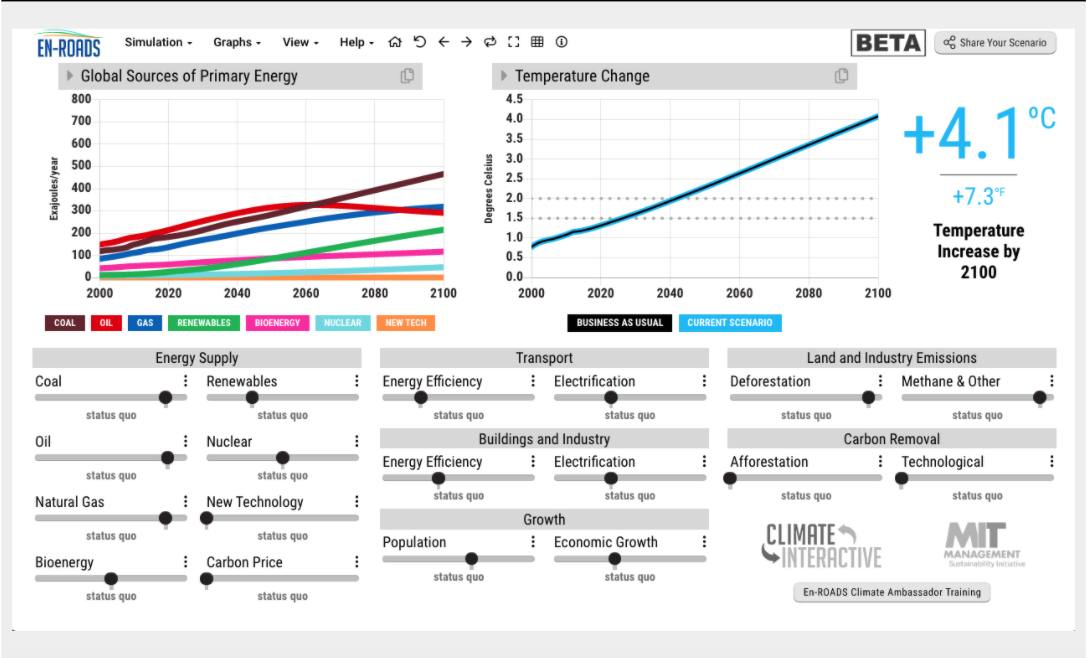
The graph in upper left shows global primary energy sources projected from 2000 to 2100 in exajoules. An exajoule is 277.8 Terawatt hours. The graph on the right shows the increase in MGT given that energy mix and a variety of other factors. The sliders below the graphs are how you control those factors. These factors include energy supply, the efficiency and degree of electrification of sector consumption, global population and economic growth, land and industry emissions, and carbon sequestration strategies.
This default screen shows the “business as usual” (BAU) scenario. The BAU is what we might expect to see if stay on our current development pathway of increased energy use matched with increased use of fossil fuels. In this scenario the increase in MGT in 2100 is 4.1°C, nearly 2°C above the upper target of the 2015 Paris Accord. To reach the Paris target you will need to adjust some, or all of the factors controlled by the sliders in the bottom half of the screen. Here are the questions you will be addressing as you do so.
Questions
- Beginning with any of the existing energy sources (coal, oil, natural gas, bioenergy, renewables, and nuclear) what does it take to reduce or increase the amount of energy provided by that source? Watch the caption underneath each slide as you adjust that energy source.
- Given that in 2017 three fossil fuels provided nearly 85% of global energy consumption and produced 95% of all energy / industry related CO2 emissions, what would be the impact on the 2100 MGT increase of reducing all three fuels the maximum amount?
- Reducing which fuel has the greatest impact on the 2100 MGT increase? To do this reset the simulation and adjust each fuel separately, making sure to set it back to status quo before trying the next fuel.
- For the BAU scenario (reset the simulation) what impact does maximizing carbon price have on 2100 MGT increase? What is carbon price? Click on the three dots above the carbon price slider for an explanation?
- For the BAU scenario, what impact does setting population and economic growth to a minimum have on 2100 MGT increase? What impact does setting population and economic growth to a maximum have?
- What impact does setting all three fossil fuels to minimum, while increasing renewables to maximum have on 2100 MGT increase? Make sure to reset all sliders to status quo before doing this.
- What impact does setting all three fossil fuels to minimum, while increasing nuclear to maximum have on 2100 MGT increase? Make sure to reset renewables to status quo before maximizing nuclear.
- For the BAU scenario, what impact does setting electrification to maximum for transport, and buildings and industry have on 2100 MGT increase?
- For the BAU scenario, what impact does setting energy efficiency to maximum for transport, and buildings and industry impact 2100 MGT increase?
- For the BAU scenario, what is the 2100 MGT increase if land and industry emissions are reduced and carbon removal is increased the maximum amount?
- What is meant by deforestation, methane and other, afforestation, and technological carbon removal? Click on the three dots next to each title for an explanation.
Having done this background work, adjust energy supply, sector energy efficiency and electrification, land and industry emissions, and carbon removal, population, and economic growth to achieve the Paris target – 2100 MGT increase below 2.0°C with concerted effort to stay as close to 1.5°C as possible.
Record your results in Table 23.2.2 on the following page. Once this is done complete the graph in figure 4 to show your global energy plan from now until 2100. Finally, write a paragraph summary of your plan that outlines its major features and the tradeoffs inherent in the plan (strengths, limitations, risks, and benefits).
2.1 Increase in MGT by 2100 ___________°C
2.2 Energy Supply
Energy produced by each source as read from the graph is in exajoules (EJ). Once you have recorded the contribution of each source, sum them to derive the total global consumption for each year.
| Source | 2020 | % Total | 2060 | % Total | 2100 | % Total |
| Coal | ||||||
| Oil | ||||||
| Natural Gas | ||||||
| Bioenergy | ||||||
| Renewables | ||||||
| New Tech |
| Total Consumption |
| EJ |
2.3 Carbon Price _________________________
2.4 Sector Consumption
| Sector | Energy Efficiency | Electrification |
| Transport | ||
| Buildings and Industry |
2.5 Growth
| Population | |
| Economic |
2.6 Land and Industry Emission
| Deforestation | |
| Methane & Others |
2.7 Carbon Removal
| Afforestation | |
| Technological |
Table \(\PageIndex{2}\): Worksheet for recording your results for the final problem in part C