
1.5: Current World Oil Market
- Page ID
- 47687

\( \newcommand{\vecs}[1]{\overset { \scriptstyle \rightharpoonup} {\mathbf{#1}} } \)
\( \newcommand{\vecd}[1]{\overset{-\!-\!\rightharpoonup}{\vphantom{a}\smash {#1}}} \)
\( \newcommand{\id}{\mathrm{id}}\) \( \newcommand{\Span}{\mathrm{span}}\)
( \newcommand{\kernel}{\mathrm{null}\,}\) \( \newcommand{\range}{\mathrm{range}\,}\)
\( \newcommand{\RealPart}{\mathrm{Re}}\) \( \newcommand{\ImaginaryPart}{\mathrm{Im}}\)
\( \newcommand{\Argument}{\mathrm{Arg}}\) \( \newcommand{\norm}[1]{\| #1 \|}\)
\( \newcommand{\inner}[2]{\langle #1, #2 \rangle}\)
\( \newcommand{\Span}{\mathrm{span}}\)
\( \newcommand{\id}{\mathrm{id}}\)
\( \newcommand{\Span}{\mathrm{span}}\)
\( \newcommand{\kernel}{\mathrm{null}\,}\)
\( \newcommand{\range}{\mathrm{range}\,}\)
\( \newcommand{\RealPart}{\mathrm{Re}}\)
\( \newcommand{\ImaginaryPart}{\mathrm{Im}}\)
\( \newcommand{\Argument}{\mathrm{Arg}}\)
\( \newcommand{\norm}[1]{\| #1 \|}\)
\( \newcommand{\inner}[2]{\langle #1, #2 \rangle}\)
\( \newcommand{\Span}{\mathrm{span}}\) \( \newcommand{\AA}{\unicode[.8,0]{x212B}}\)
\( \newcommand{\vectorA}[1]{\vec{#1}} % arrow\)
\( \newcommand{\vectorAt}[1]{\vec{\text{#1}}} % arrow\)
\( \newcommand{\vectorB}[1]{\overset { \scriptstyle \rightharpoonup} {\mathbf{#1}} } \)
\( \newcommand{\vectorC}[1]{\textbf{#1}} \)
\( \newcommand{\vectorD}[1]{\overrightarrow{#1}} \)
\( \newcommand{\vectorDt}[1]{\overrightarrow{\text{#1}}} \)
\( \newcommand{\vectE}[1]{\overset{-\!-\!\rightharpoonup}{\vphantom{a}\smash{\mathbf {#1}}}} \)
\( \newcommand{\vecs}[1]{\overset { \scriptstyle \rightharpoonup} {\mathbf{#1}} } \)
\( \newcommand{\vecd}[1]{\overset{-\!-\!\rightharpoonup}{\vphantom{a}\smash {#1}}} \)
\(\newcommand{\avec}{\mathbf a}\) \(\newcommand{\bvec}{\mathbf b}\) \(\newcommand{\cvec}{\mathbf c}\) \(\newcommand{\dvec}{\mathbf d}\) \(\newcommand{\dtil}{\widetilde{\mathbf d}}\) \(\newcommand{\evec}{\mathbf e}\) \(\newcommand{\fvec}{\mathbf f}\) \(\newcommand{\nvec}{\mathbf n}\) \(\newcommand{\pvec}{\mathbf p}\) \(\newcommand{\qvec}{\mathbf q}\) \(\newcommand{\svec}{\mathbf s}\) \(\newcommand{\tvec}{\mathbf t}\) \(\newcommand{\uvec}{\mathbf u}\) \(\newcommand{\vvec}{\mathbf v}\) \(\newcommand{\wvec}{\mathbf w}\) \(\newcommand{\xvec}{\mathbf x}\) \(\newcommand{\yvec}{\mathbf y}\) \(\newcommand{\zvec}{\mathbf z}\) \(\newcommand{\rvec}{\mathbf r}\) \(\newcommand{\mvec}{\mathbf m}\) \(\newcommand{\zerovec}{\mathbf 0}\) \(\newcommand{\onevec}{\mathbf 1}\) \(\newcommand{\real}{\mathbb R}\) \(\newcommand{\twovec}[2]{\left[\begin{array}{r}#1 \\ #2 \end{array}\right]}\) \(\newcommand{\ctwovec}[2]{\left[\begin{array}{c}#1 \\ #2 \end{array}\right]}\) \(\newcommand{\threevec}[3]{\left[\begin{array}{r}#1 \\ #2 \\ #3 \end{array}\right]}\) \(\newcommand{\cthreevec}[3]{\left[\begin{array}{c}#1 \\ #2 \\ #3 \end{array}\right]}\) \(\newcommand{\fourvec}[4]{\left[\begin{array}{r}#1 \\ #2 \\ #3 \\ #4 \end{array}\right]}\) \(\newcommand{\cfourvec}[4]{\left[\begin{array}{c}#1 \\ #2 \\ #3 \\ #4 \end{array}\right]}\) \(\newcommand{\fivevec}[5]{\left[\begin{array}{r}#1 \\ #2 \\ #3 \\ #4 \\ #5 \\ \end{array}\right]}\) \(\newcommand{\cfivevec}[5]{\left[\begin{array}{c}#1 \\ #2 \\ #3 \\ #4 \\ #5 \\ \end{array}\right]}\) \(\newcommand{\mattwo}[4]{\left[\begin{array}{rr}#1 \amp #2 \\ #3 \amp #4 \\ \end{array}\right]}\) \(\newcommand{\laspan}[1]{\text{Span}\{#1\}}\) \(\newcommand{\bcal}{\cal B}\) \(\newcommand{\ccal}{\cal C}\) \(\newcommand{\scal}{\cal S}\) \(\newcommand{\wcal}{\cal W}\) \(\newcommand{\ecal}{\cal E}\) \(\newcommand{\coords}[2]{\left\{#1\right\}_{#2}}\) \(\newcommand{\gray}[1]{\color{gray}{#1}}\) \(\newcommand{\lgray}[1]{\color{lightgray}{#1}}\) \(\newcommand{\rank}{\operatorname{rank}}\) \(\newcommand{\row}{\text{Row}}\) \(\newcommand{\col}{\text{Col}}\) \(\renewcommand{\row}{\text{Row}}\) \(\newcommand{\nul}{\text{Nul}}\) \(\newcommand{\var}{\text{Var}}\) \(\newcommand{\corr}{\text{corr}}\) \(\newcommand{\len}[1]{\left|#1\right|}\) \(\newcommand{\bbar}{\overline{\bvec}}\) \(\newcommand{\bhat}{\widehat{\bvec}}\) \(\newcommand{\bperp}{\bvec^\perp}\) \(\newcommand{\xhat}{\widehat{\xvec}}\) \(\newcommand{\vhat}{\widehat{\vvec}}\) \(\newcommand{\uhat}{\widehat{\uvec}}\) \(\newcommand{\what}{\widehat{\wvec}}\) \(\newcommand{\Sighat}{\widehat{\Sigma}}\) \(\newcommand{\lt}{<}\) \(\newcommand{\gt}{>}\) \(\newcommand{\amp}{&}\) \(\definecolor{fillinmathshade}{gray}{0.9}\)Current World Oil Market
The current market for crude oil is truly global in reach. Oil cargoes move with relative ease between countries and across oceans. While most U.S. oil imports come from a relatively small group of countries, it is misleading to think that only those countries have an impact on oil prices in the United States. Because oil can and does move so freely from one area to another across the globe, it is better to think of the oil market as a global pool, rather than as a network of suppliers and buyers. If one supplier shrinks the overall depth of the pool by withholding supply (or floods the pool by producing a lot of oil), then the impact will be felt uniformly throughout the pool.
At this point you should listen to episodes 1, 2 and 3 of the Planet Money Buys Oil podcast. This podcast is very entertaining and will give you a sense of what the "physical" market for crude oil is like. The physical market is what we've been talking about so far in the lesson - the part of the oil market where buyers and sellers exchange money for crude oil. In the next part of the lesson we'll move into the "futures market" for crude oil, which is where all sorts of different market players hedge and speculate on the physical price of crude oil. Episode 3 gets a little beyond crude oil into the refining area, which is the topic of Lesson 2. But it's still worth listening to at this point.
Pricing of oil is determined largely by a mix of supply factors, demand factors, and panic. How much of any given oil-price movement is due to each of these three factors is an eternal mystery that keeps a small army of editorial columnists and television talking-heads in business. The supply-demand balance is perhaps the easiest piece to explain - when demand is high (for example, during the wintertime when heating oil demands are high or during the summer when people tend to drive more often and further distances), consumers are willing to pay more for refined petroleum products, and higher-cost oil supplies must be brought online. Thus, the price goes up. Similarly, when accidents, political strife, or war keep supplies offline, higher-cost replacements must be found, and the price goes up. Panic in the oil market is not always rational but does happen. Its roots can be traced back to OPEC's successes in the 1970s of increasing world oil prices, even for brief periods. Believing that OPEC had the power to do pretty much whatever it wanted, market participants began engaging in a series of self-fulfilling prophecy games. They worked something like this. First, one or more market participants would believe that OPEC would act to increase prices or reduce supply. Afraid of getting caught short or unable to fulfill contracts, stockpiling commenced, pushing up spot prices. Thus, all OPEC needed to do was cause panic in the markets by spreading rumors of policy changes. The gains were nearly always short lived as the high cost of inventories would result in sell-offs, bringing oil prices down to prepanic levels. Nowadays, broader geopolitical concerns, particularly in the Middle East and Africa, have replaced the grumblings of OPEC as the source for panic-induced spikes in oil prices.
OPEC was mentioned earlier as an entity that has been able to exert substantial influence on global markets for crude oil. OPEC operates as a cartel - a group of producing countries that attempt to coordinate supply decisions in order to exert some influence on prices. OPEC does not try to set prices directly, is as often believed. What OPEC countries try to do is to expand or contract oil production in order to keep the world price within some band that the countries collectively deem desirable.
OPEC's actual ability to manipulate oil prices is not all that clear, and its influence has dwindled as more "unconventional" petroleum resources have been developed, including the oil sands in Canada and shale oil in the United States. Most cartels are difficult to sustain, since each member of the cartel has an incentive to cheat - in OPEC's case, this means that countries have often produced more oil than they were supposed to under the quota system, as shown in \(Figure \text { } 1.3\) (the most consistent cheater seems to have been the country of Algeria). Even during the 1973 embargo, none of the OPEC nations approached the formal 5% production cut mentioned in the embargo. Saudi Arabia's production decreased by 0.8%. Iraq and Oman saw the biggest percentage cuts in production at 1%. Prices did indeed go up, but largely as a result of fear and higher taxes rather than actual supply shortages. The actual production cuts lasted only three weeks; the embargo fell apart in December when Saudi Arabia raised production.
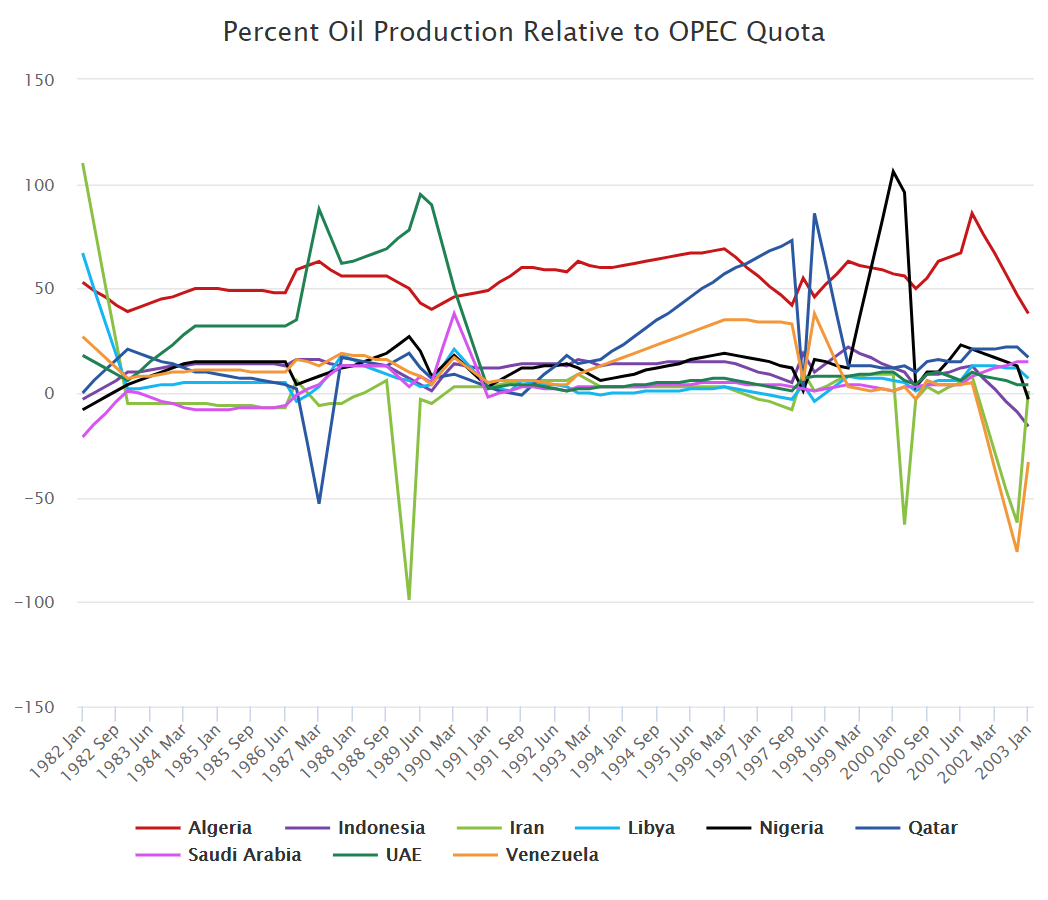
\(Figure \text { } 1.3\): Cheating Among OPEC Nations, 1982 - 2003.
While OPEC has historically been viewed as a cartel that keeps oil prices high, its members have, more recently, probably been at least partially responsible for the rapid decline in oil prices. The Economist has a nice and recent article describing the factors that have been contributing to the slide in oil prices. This has been partly due to sluggish economies in developing countries, energy efficiency in rich countries, the boom in shale-oil production in the United States (which we will come back to in a few weeks) and a strategic decision by Saudi Arabia to maintain high oil production levels even in the face of low prices (this is perhaps an attempt to inflict economic pain on the shale-oil business in the U.S.).
While the market for oil is global in reach, trade has clustered itself into several primary regions. This has happened despite shipping costs that are generally low (only a few dollars per barrel) and the ease with which oil cargoes can be directed and redirected towards the highest-priced buyers (in financial terms, oil is "fungible"). Nevertheless, prices in these regions tend to move in tandem. In the homework assignment for this week, you will get some hands-on experience using prices for some of these regional crude oils to investigate how world oil prices move relative to one another.
One reason for regional pricing of crude oil is that it is a heterogeneous commodity - not all crude oils are alike. Some oil can be extracted at a cost of a few dollars per barrel, and flows like water (it would look like Coca-Cola coming out of the ground). Other oil requires sophisticated equipment, techniques and processing to extract, and is thick as tar, requiring special methods to transport it to the refinery (and to refine into saleable petroleum products). In general, oil with a low viscosity is referred to as "light," while thicker, higher-viscosity crude oils are referred to as "heavy." Light oils are generally valued higher than heavy oils. The viscosity of crude oil is measured on a scale known as the API gravity (API stands for "American Petroleum Institute"). The API gravity scale measures how heavy or light a crude oil is, relative to water (thus the terms heavy and light oil). The API gravity of a crude oil is measured by taking its specific gravity (density relative to water), and calculating: \[\text { API Gravity }=(141.5 \div \text { Specific Gravity })-131.5.\]
Sulfur content is another important determinant of value; the lower the sulfur content the better. So-called "sweet" oils are low in sulfur, while "sour" oils have a higher sulfur content. There are some differences in crude oil quality among the major trading regions. Pricing of heterogeneous commodities often involves establishing a benchmark or "marker" price that is used to track general price movements. Pricing in any particular transaction is based on the marker price, with adjustments for location and quality. Below are some brief descriptions of some of the major global benchmark oil streams, and the Energy information Administration has a very nice article on the most important global marker prices. The first two, West Texas Intermediate (WTI) and Brent, are the most important benchmark oil prices in the world.
- West Texas Intermediate (WTI) is a light crude oil that is primarily representative of the U.S. market. It is a "light sweet" oil, meaning that it has low density (high API gravity of around 40) and a low sulfur content.
- Brent is a blend of light sweet crude oils from the North Sea, off the coast of the United Kingdom. Its API gravity is around 38 and it has a somewhat higher sulfur content than WTI. Still, in terms of quality, WTI and Brent are largely comparable.
- Fateh is a crude oil stream from the emirate of Dubai (which is why it is sometimes simply called "Dubai Crude"). Fateh has an API gravity of around 31, making it a denser crude oil than either WTI or Brent. Fateh is also classified as a "sour" oil for having a higher sulfur content than WTI or Brent. The importance of Fateh as a benchmark oil price is that it is representative of crude oil shipments from the Middle East to Asia.
- Bonny Light is a light sweet crude oil stream from Nigeria. It serves as a benchmark for African crude oils because its low density and sulfur content make it comparable to WTI and Brent (and, indeed, the major source of demand for Bonny Light has historically been refineries in Europe and the U.S.).
- Urals is a heavy (low API gravity) and sour crude oil blend from Russia. It serves as a benchmark for oil exports from Russia.
Earlier, I mentioned that when demand increases, higher-cost supplies must be brought online to meet that higher demand. Prices for oil have certainly been on a roller-coaster ride over the past few years, going from more than $100 per barrel a few years ago to less than $30 per barrel at the time that you are reading this lesson. Does this mean that a few years ago, we thought all of the cheap oil in the world was gone, but we have now discovered new supplies of cheap oil? And if not, then what explains the price movements that we have seen in the oil market in recent years?
The answer depends on some understanding of the cost of supplying crude oil. \(Figure \text { } 1.4\) provides a rough idea of the cost of extracting different types of oil resources. The low-cost resources are conventional oil fields that have been operating for decades. The higher-cost resources are so-called "unconventional" sources of oil, including deepwater or Arctic drilling; the oil sands of Alberta, Canada; and extraction of oil from shale formations (one of the best-known examples is the Bakken shale in North Dakota, whose extraction costs are somewhere in the lower end of the range shown - perhaps around $50 to $60 per barrel). If the producers of conventional oil were to flood the market, then the price would drop so low that unconventional players would be forced to shut down. This would be good for consumers right now, but bad for the producers of conventional oil (and eventually for consumers), since there would be less oil to sell later on. Thus, conventional oil producers hold some output back, leaving the unconventional producers to serve the leftover or "marginal" demand. This is good for conventional oil producers in both the short and long term (because they earn larger profits), but is bad for consumers in the short term. (In the long term, this strategy keeps prices from rising to even higher levels in the future.)
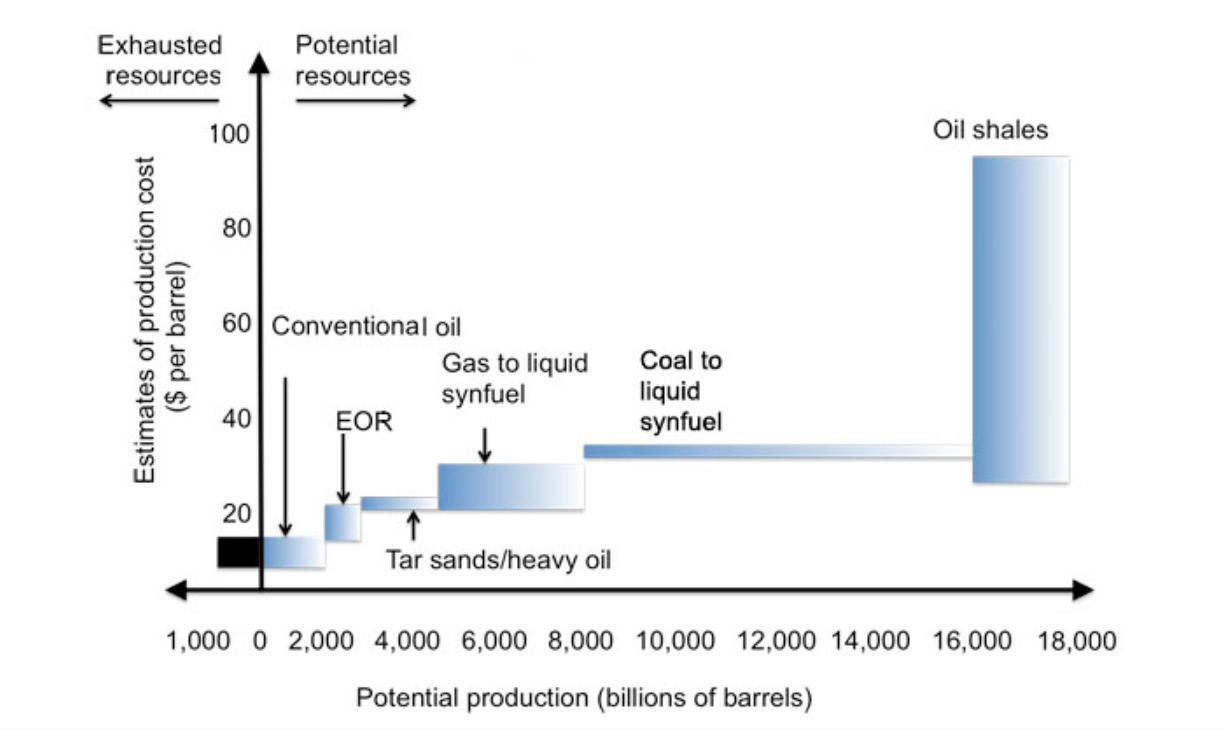
\(Figure \text { } 1.4\): Estimates of production costs of various petroleum products.
Part of the reason that crude-oil prices have been so high for so long is the increased role that unconventional oil is playing in world oil supply. This is due in some part to the natural decline in output that is expected from conventional oil fields as they mature (more on this later when we talk about "peak oil"). The growth in unconventional oil supplies has been so rapid that countries with large reserves of unconventional oil, such as the United States, have become large oil producers in a very short period of time, as shown in \(Table \text { } 1.2\). It may be worth noting that the world's largest oil reserves are estimated to be held by Venezuela, which is the 11th largest oil producer in the world. There are lots of political reasons that Venezuela is not a larger oil producer, but one economic reason is that lots of Venezuela's oil assets are unconventional and heavy. This means that they take time to develop, and the oil they produce has less value on the world market (i.e., it is costlier to ship and refine).
\(Table \text { } 1.2\): Ten Largest World Oil Producers, 2005 and 2013
Source: EIA and BP Review of World Energy
|
2005 Top Ten Oil Producers |
1,000 BBL/Day |
2013 Top Ten Oil Producers |
1,000 BBL/Day |
|
1. Saudi Arabia |
11,096 | 1. Saudi Arabia | 11,726 |
| 2. Russia | 9,511 | 2. Russia | 10,788 |
| 3. United States | 8,329 | 3. United States | 10,003 |
| 4. Iran | 4,239 | 4. China | 4,180 |
| 5. China | 3,809 | 5. Canada | 3,948 |
| 6. Mexico | 3,784 | 6. Iran | 3,558 |
| 7. Canada | 3,096 | 7. United Arab Emirates | 3,646 |
| 8. Norway | 2,978 | 8. Iraq | 3,141 |
| 9. Venezuela | 2,867 | 9. Kuwait | 3,126 |
| 10. United Arab Emirates | 2,845 | 10. Mexico | 2,875 |