
7.4: Capacity Markets
- Page ID
- 47797

Capacity Markets
Many restructured electricity markets offer power generators payments for the capacity that they have ready to produce electricity, not just for the electricity that they actually produce. For example, if you owned a 100 MW (100,000 kW) power plant and the capacity payment was $10 per kW per month, you would earn $12 million per year regardless of how much electricity you actually produced. In areas that have them, capacity payments have become a major portion of a generator’s revenue stream.
Capacity markets are a little bit odd. Almost no other market for any commodity, anywhere in the world, has them. (There is a capacity market for natural gas pipelines, but it is operated differently than electricity capacity markets.) In markets for other non-storable goods, like hotel rooms and seats on airplanes, any fixed costs of operations are rolled into the room rate or ticket price. If there is enough unused capacity, then it will exit the market (the hotel will close, or the airline will go bankrupt). Yet, this doesn’t really happen in electricity.
There are three features in electricity markets that have justified the need for capacity markets – two are regulatory interventions. The first goes back to 1965, when a large blackout crippled much of the U.S. northeast. Rather than being saddled with additional regulations imposed by an angry government, the electricity industry adopted a set of then-voluntary standards for reliability. (The standards are now mandatory.) One of these standards was called the “installed capacity” requirement, which stated that electric grid operators needed to control more capacity than they thought they would need to meet peak demand. For example, if annual peak electricity demand in your system was 100 MW, you might be required to own or control 120 MW of capacity, just in case your power plants broke; your estimate of demand was wrong; or some combination of both. This extra capacity requirement is sometimes called the “capacity margin.”
The second intervention goes back to California’s power crisis of 2000 and 2001. California was one of the first states to deregulate its electricity industry, and it got a lot wrong in the deregulation process. In particular, as firms like Enron found out, the markets created in California were ridiculously simple to manipulate. Prices could easily be driven to levels 100 times higher than normal. Following California’s debacle, other regions did push forward with deregulation, but no one wanted to be the next California. So, virtually all restructured markets instituted “caps” (or upper limits) on electricity prices. In PJM, for example, the price cap is set at $1,000 per MWh. This is the maximum amount that any company may charge for electricity. The markets also instituted watchdogs known as “market monitors” who are tasked with reviewing supply bids submitted by generating companies and flagging those that are deemed to be manipulative. California showed us that electricity markets (even those that are well-designed) are susceptible to manipulation, so many of these market monitors are quite aggressive, punishing firms that submit bids that are higher than marginal costs.
The final regulatory intervention is retail electric rates that are fixed and do not reflect fluctuations in the cost of generating electricity. This has partly been justified on the grounds of protecting consumers from volatile energy prices (the fact is that no energy commodity has more price volatility than does electricity), and also due to the fact that the electric meters that most customers have are still based on a century-old analog technology that does not allow the utility to bill customers based on time of use.
So, suppose that the electric system operator decided that a new power plant needed to be built “for reliability” (i.e., in order to meet the installed capacity requirement). In a market environment, all you would need is for someone to build the plant, operate it during times of peak demand when prices are relatively high, and rake in the dough. Sounds simple enough, right?
\(Figure \text { } 7.3\) shows why, in fact, the situation is not so simple. The figure shows the average cost of producing one megawatt-hour from a new natural gas power plant (the “levelized cost of energy,” which we will meet in detail in a future lesson), as a function of how often the plant operates. The more hours the plant operates, the more productive hours over which it can spread its capital cost so the lower price it would need to charge in order to be profitable. A typical power plant that would operate only during the highest-priced hours would need to charge a price higher than the price cap in order to remain financially solvent. Furthermore, consumers buying energy from that plant would pay the fixed retail rate, not the plant’s levelized cost of energy.
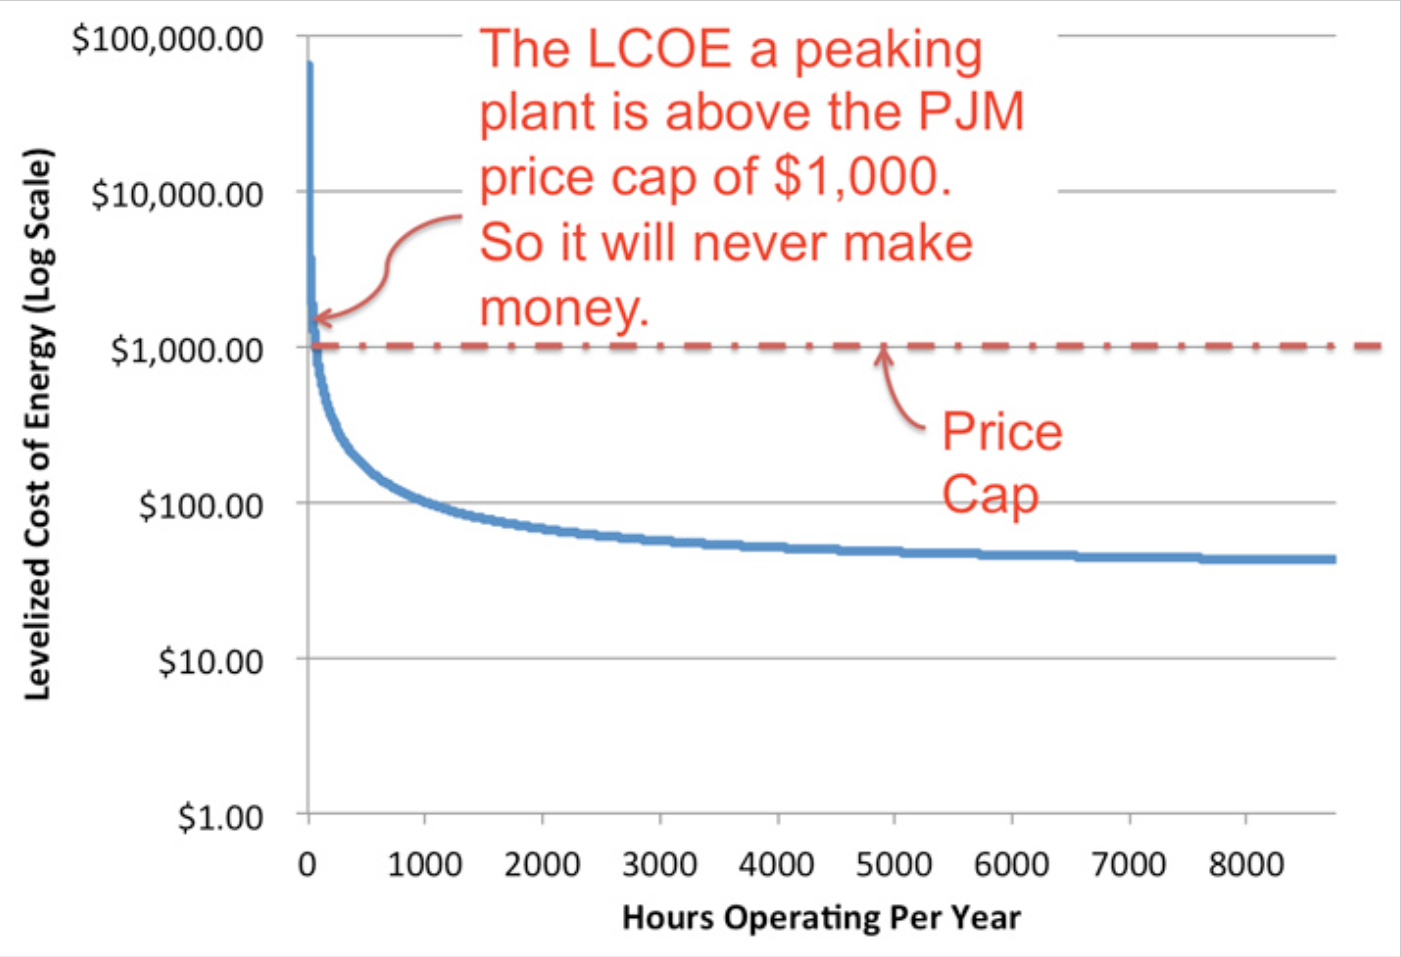
\(Figure \text { } 7.3\): Levelized cost of energy for a new natural gas power plant.
\(Figure \text { } 7.3\) basically illustrates the conundrum: someone needs to build the plant for reliability reasons. But because of price caps and fixed retail pricing, no one would ever make money operating this plant. We are stuck in a contradiction – the system operator needs to maintain its installed capacity margin, but no power generation company has any incentive to build the plants that will meet this regulatory requirement.
In electric systems that have not restructured, this isn’t so much of a problem since the regulated utility can ask its public utility commission to pass through the costs of this plant to its ratepayers. But in a deregulated generation environment, there is no guarantee of cost recovery. This conundrum is sometimes called the “missing money” problem. Capacity payments are supposed to solve this problem by providing additional revenue to power plants to keep them operating. It is important to realize that capacity payments have been incredibly controversial since they are sometimes viewed as windfall profits for power generators.
To see the relevance to VER integration, let’s take our example of the uniform price auction from the previous lesson. In that example, we have five generators and demand is 55 MWh. Generator D clears the market and the SMP is $40/MWh. Profits are:
- Firm A: $300
- Firm B: $375
- Firm C: $200
- Firm D: $0
- Firm E: $0
You can see how Firm D might have a “missing money” problem since it produces electricity but earns no profits. If Firm D is the “marginal generator” too often, it will not be able to cover any fixed costs and will eventually go out of business. (We didn’t have fixed costs in the example, but most power plants do have some fixed costs of operation, like land leases or other rental payments.)
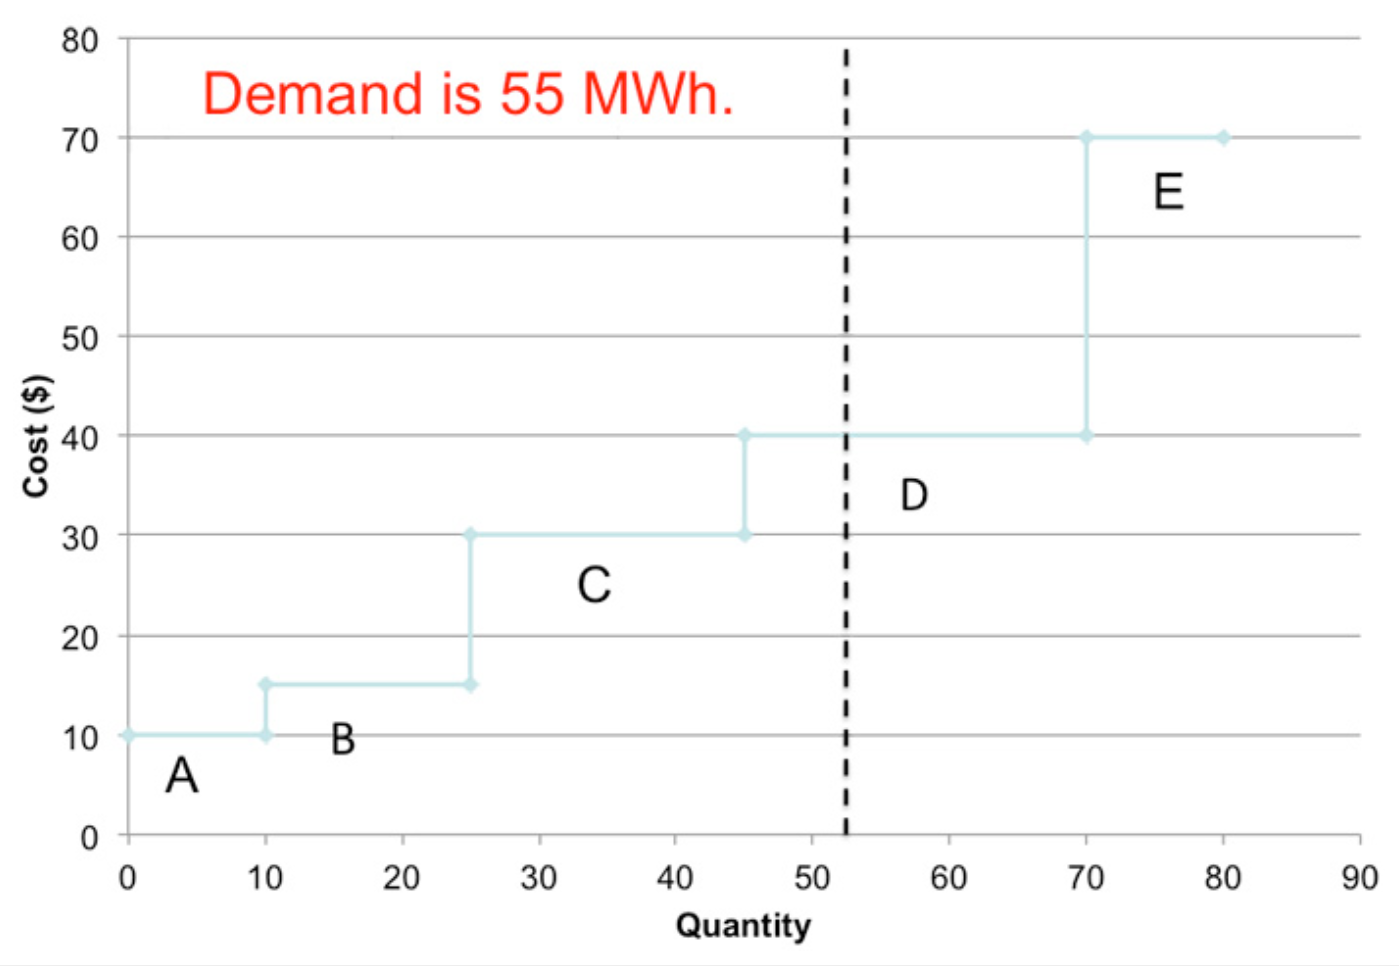
\(Figure \text { } 7.4\): Illustrating the uniform price auction.
Now suppose that a 20 MW wind plant was built in this market. Wind energy has a very low marginal cost – so close to zero that we can just call it zero for this example. This new wind energy plant moves the entire dispatch curve to the right by 20 MW. If the wind is producing at full capacity and demand is 55 MWh, then Firm C becomes the market-clearing generator and the SMP falls to $30/MWh. (The 20 MW of wind with zero marginal cost has the same effect on Firms A through E as a 20 MW decline in electricity demand – why?) Try recalculating profits yourself under this scenario. You should get:
- Firm A: $200
- Firm B: $225
- Firm C: $0
- Firm D: $0
- Firm E: $0
- Wind Farm: $600
While it is nice that the wind farm’s profits are so high and that the wholesale price of power has fallen, three of the five existing generating firms are not making any profit and might consider shutting down altogether. But according to reliability rules, we need those plants to be operating in order to have enough bulk generation capacity. Because of this requirement, the wind farm has effectively instigated a “missing money” problem for some of the other generators in the system. Hence, there is some need for a capacity payment or other revenue stream, but only because of the regulatory requirements for installed capacity.
To figure out what the capacity payment needs to be for a specific generator, we can compare its revenues to its total costs. The difference represents the capacity payment needed for the power plant to break even. Consider two cases as an illustration. First, suppose that Firm C in our example above had fixed costs of $100. With the wind plant in the market, Firm C breaks even on its operating costs (the SMP is $30 per MWh and its production cost is also $30 per MWh) but covers zero of its fixed costs. So, the capacity payment needed for Firm C would be $100. As a second example, suppose that Firm A had fixed costs of $250. With the wind plant in the market, Firm A earns $200 in operating profit, but its fixed costs are $250. Its total profit would thus be -$50 and Firm A would need a capacity payment of $50 in order to break even.
Finally, suppose that Firm B had fixed costs of $100. With operating profits of $225, Firm B earns a total profit of $225 - $100 = $125. Thus, Firm B is profitable even without a capacity payment. Does that mean that Firm B is not allowed to earn a capacity payment in the electricity market? No - Firm B can compete in the capacity market and earn a capacity payment just like any other power plant. While the capacity market was set up because some power plants (like A and C in our illustrations) have revenue shortfalls, participation in the capacity market is not limited just to those plants who "need" a capacity payment to avoid losing money.
You might be wondering what happened to the 20 MW of new wind – doesn’t that count as “capacity?” The answer is that different regions have very different ways of allocating capacity credits to VERs. Typically, the system operator will let a VER count for a fraction of its capacity. So, our 20 MW wind farm in this example would count for perhaps 2 or 3 MW towards the system-wide installed capacity requirement.
In some areas with a high penetration of VERs, particularly wind, the price of electricity has started to become negative, meaning that suppliers must pay the system operator in order to keep producing electricity. This also means that consumers get paid to use more electricity, which sounds like a terrific deal. Here’s how such a thing is possible. Mount Storm Lake in West Virginia is home to both a large coal plant (one of the biggest in the state) and a large wind farm. These plants are connected to the same transmission line that winds its way towards Washington D.C. This transmission line is almost always congested, so the Mount Storm group of power plants cannot always produce at full combined capacity. During an autumn evening, when electricity demand is low, the Mount Storm coal plant is producing at full capacity and meeting electricity demand. All of a sudden, the wind picks up and the Mount Storm wind farm starts to generate a lot of power and there is excess supply at Mount Storm. What options does the system operator have? It could simply shut down the coal plant (which would be hard to do quickly since coal plants are inflexible) or shut down the wind farm (which, as you saw in Vermont, is not without its own problems). Or it could allow the price to go negative and charge either (or both) plants to continue to produce electricity. If there happened to be some electricity consumer at Mount Storm, that consumer could get paid for absorbing that excess supply locally.