
2.5: Energy Reserves
- Page ID
- 47161

It is clear so far that the energy requirement is going to increase in the future and also that the U.S. and the rest of the world will depend on fossil fuels. These fossil fuels are non-renewable fuels with a finite lifetime. So, the question is: Will we have enough supply for future energy requirements?
The answer to this question depends on the quantity of fossil fuels we have in the ground. Energy sources that have been discovered but not produced cannot be easily measured. Trapped several feet below the surface, they cannot be measured with precision. There are several terms used to report the estimates of the energy resources. Most commonly used terms are “reserves” and “resources.”
- "Reserves" represent that portion of demonstrated resources that can be recovered economically with the application of extraction technology available currently or in the foreseeable future. Reserves include only recoverable energy.
- “Resources” represent that portion of the energy that is known to exist or even suspected to exist irrespective of technical or economic viability. So reserves are a subset of resources.
Table 2.5.1 shows the consumption of the different types of fossil fuels.
| U.S. Reserves | U.S. Annual Consumption | World Reserves | World Annual Consumption | |
|---|---|---|---|---|
| Petroleum (billions of barrels) as of Dec. 31, 2016 |
35 | 7.21 | 1707 | 35 |
| Natural gas, wet (trillion cubic ft) as of Dec. 31, 2016 | 324 | 32.1 | 6588 | 124 |
| Coal (billions of short tons) as of Dec. 31, 2016 |
260 | 0.73 | 948 | 8.28 |
As of December 31, 2016, total world proved recoverable reserves of coal were estimated at 948 billion short tons.
Five countries have nearly 73% of the world's coal reserves:
- United States—28%
- Russia—18%
- China—13%
- Australia—9%
- India—7%
Based on data from OPEC (Oil Producing and Exporting Countries) at the beginning of 2013 the highest proved oil reserves including non-conventional oil deposits are in
- Venezuela (20% of global reserves)
- Saudi Arabia (18% of global reserves)
- Canada (13% of global reserves)
- Iran (9%)
- Iraq (8%)
Based on data from BP (British Petroleum), at the end of 2016 proved gas reserves were dominated by three countries: Iran, Russia, and Qatar, which together held nearly half the world's proven reserves. According to the US CIA The World Factbook, the US has the 5th largest reserves of natural gas. Due to constant updates about the shale gas estimates, these are difficult to say with certainty.
How Long Will the Reserves Last?
How long these reserves do last depends on the rate at which we consume these reserves. For example, let’s assume that we have $100,000 in the bank (reserves) and it we draw $10,000 every year (consumption) the reserve will last for 10 years. However, in this case, we are assuming that we do not add any money to our deposit and we do not increase our withdrawal.
This is generally not true in the case of life of an energy reserve. We may find new reserves and our energy consumption or production can also increase. In the case of energy reserve, although we know that we might find new resources, we do not know how much we could find. But the consumption can be predicted with some accuracy based on the past rates.
Lifetime of Current Reserves at Constant Consumption
We can calculate the life of current petroleum reserves by dividing the current reserves by current consumption.
- At the current rate of consumption, the approximate lifetime of the world’s petroleum, natural gas, and coal reserves is 50 years, 52.8 years, and 153 years, respectively. (BP Statistical Review of World Energy)
- At the current rate of consumption, the current U. S. petroleum, natural gas, and coal reserves will last approximately for 4.88 years, 12.2 years, and 258 years, respectively.
It is important to note that the entire U.S. petroleum consumption is not coming from the U.S. reserves because we import more than one half of the consumption. Because we import more than one half of the consumption, the petroleum reserves at the current rate will last about 11 years. If the consumption increases in the future, the life will be less. However, there is also a chance of adding more reserves with more exploration and discoveries. The increase in consumption can change depending on the price of petroleum and other alternative fuels.
Therefore, these lifetimes are not carved in stone. It can be debated whether the U.S. reserves will last for 6 years or 10 years or even 20 years, but there is increasing consensus that we must change our lifestyle.
The R/P ratio can change from year to year similar to our bank balance. We can add more if we make more or consume more. That changes the time we can draw on the balance.
Figures 2.5.1, 2.5.2, and 2.5.3 illustrate that these ratios changed for coal, oil, and natural gas.
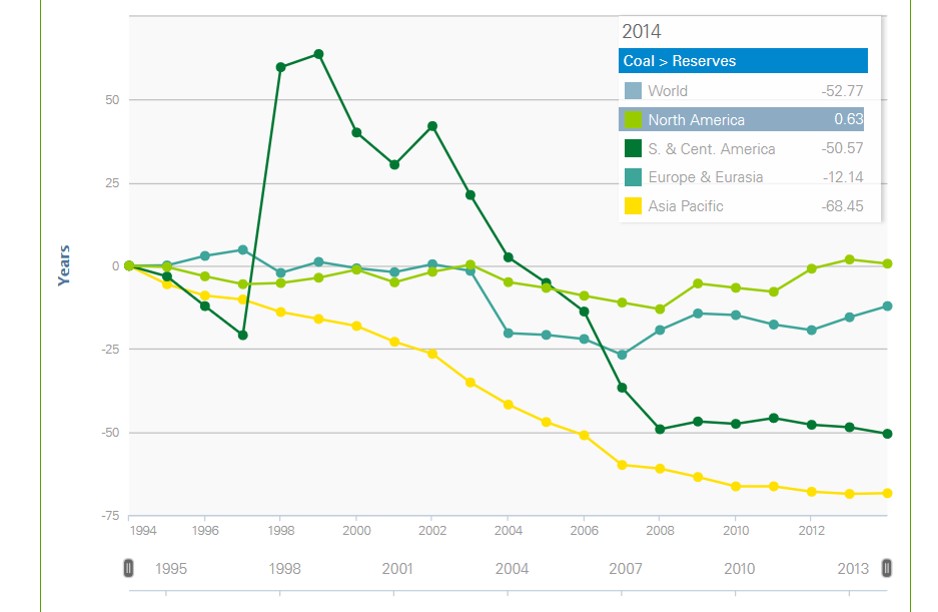
Figure 2.5.1. Variation of R/P ratio over time for coal. Credit: Data from British Petroleum
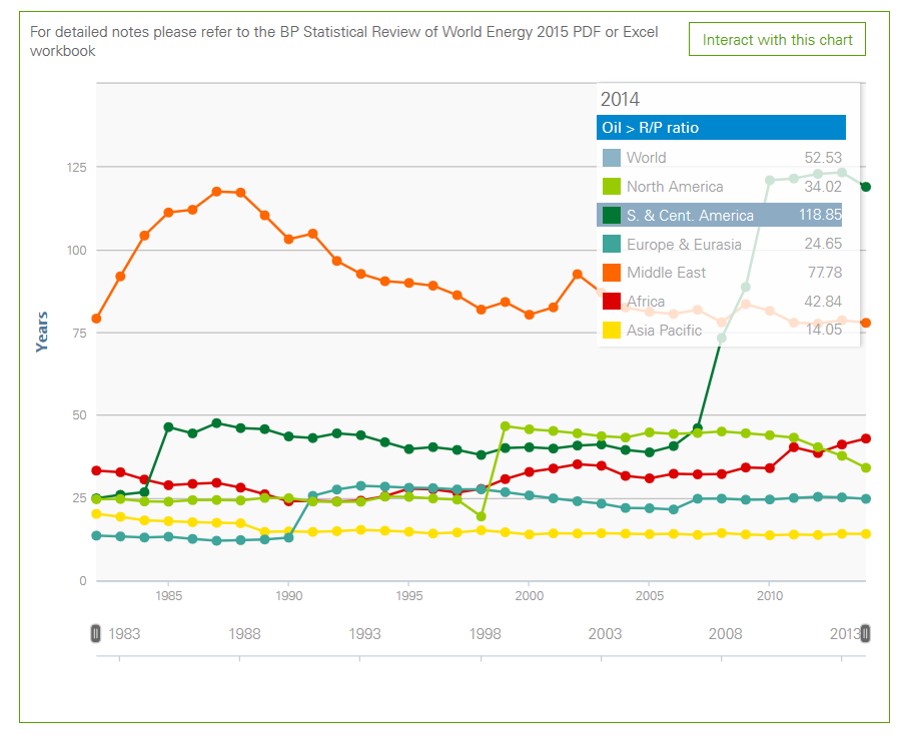
Figure 2.5.2. Variation of R/P ratio over time for oil
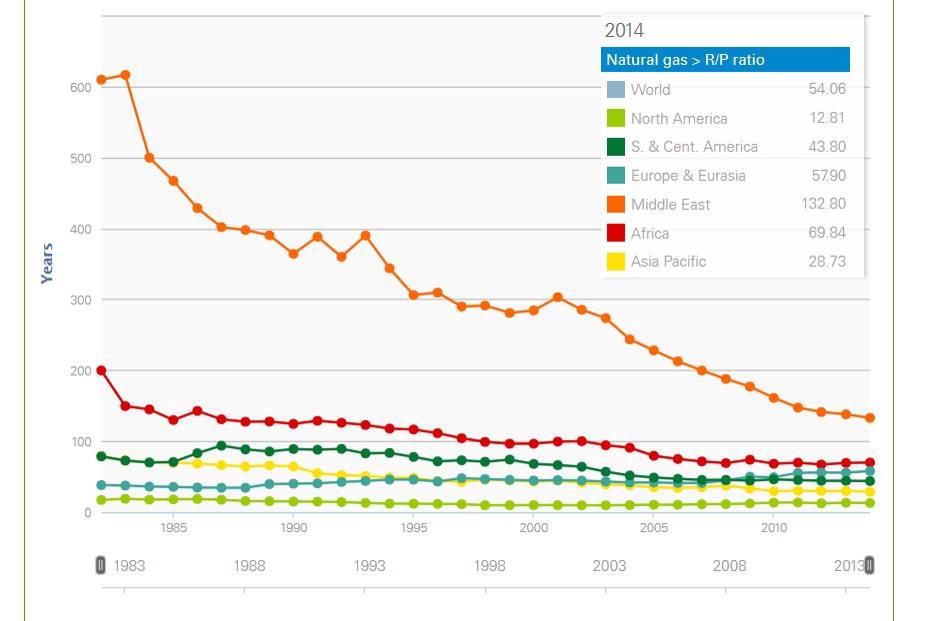
Figure 2.5.3. Variation of R/P ratio over time for natural gas
Therefore, we must conserve, innovate (get more with less), or learn to live without these resources.