
2.6: Current and Future Energy Sources of the U.S.
- Page ID
- 47162

Figure 2.6.1 shows the distribution of energy consumption in the U.S.
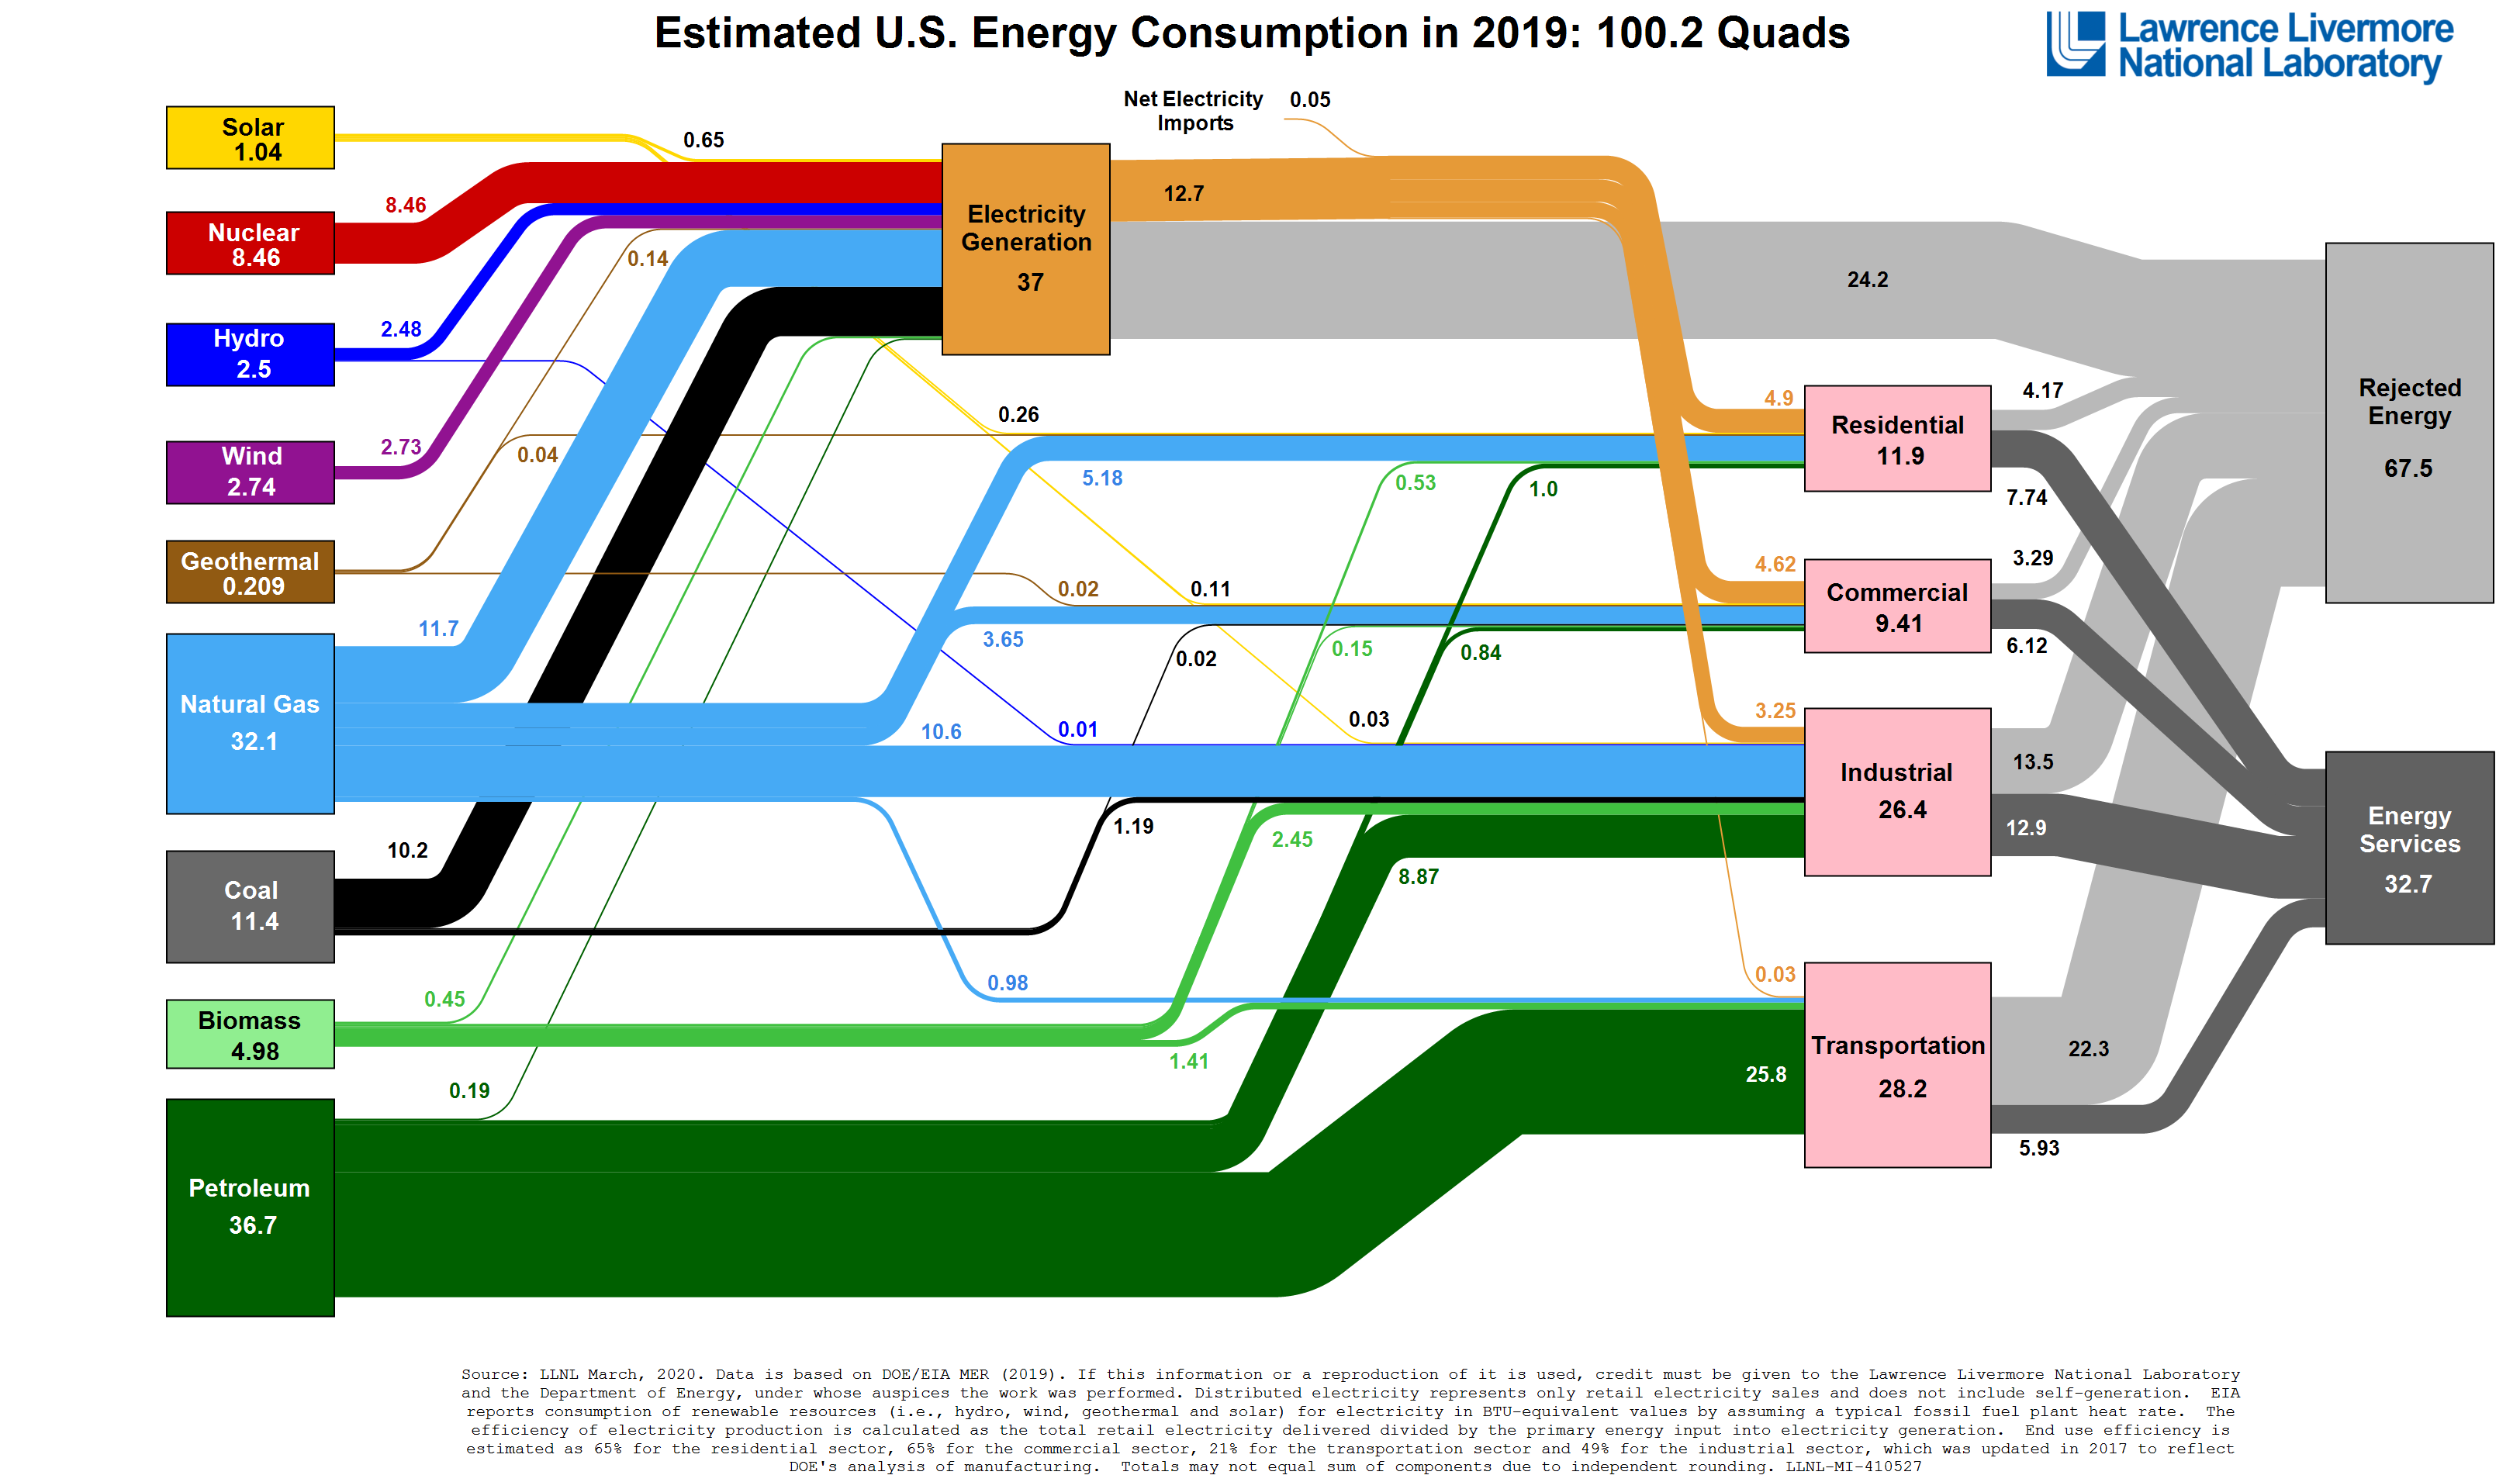
Figure 2.6.1. The 2019 energy flow chart released by the Lawrence Livermore National Laboratory details the sources of energy production, how Americans are using energy, and how much waste exists.
Figure 2.6.2 shows the quantities of fossil fuels imported by the U.S.
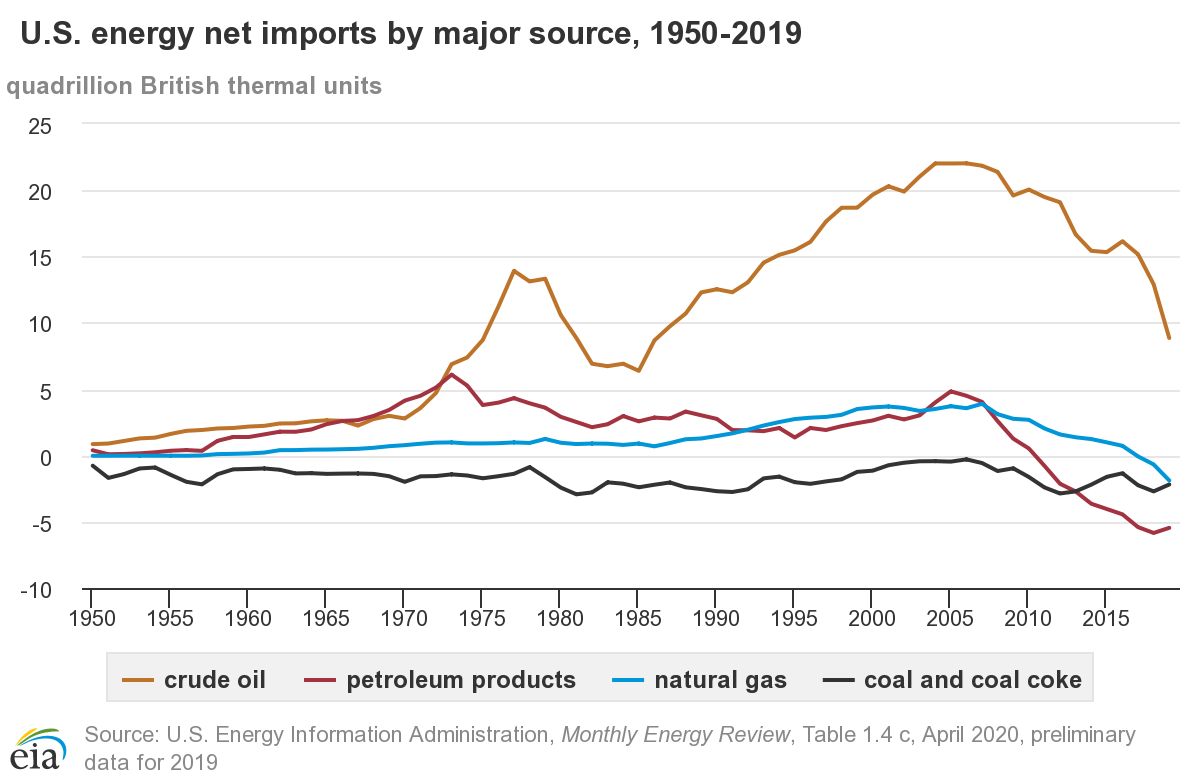
Figure 2.6.2. U.S. energy imports between 1950 and 2019
Credit: EIA Energy Explained
It can be observed from Figure 2.6.2 that the U.S. Crude oil imports have significantly reduced between 2005 and 2019 from a peak of 25 quadrillion BTUs. Another significant change that can be noted is that the U.S. is now exporting natural gas (below zero on the vertical axis) instead of importing it. Although crude oil is imported, US exports finished petroleum products resulting in less net imports. As a matter of fact, U.S. total energy exports exceeded the imports in 2019 since 1950.
The top five countries (sources) of U.S. total petroleum in 2019 were Canada (49%), Mexico (7%), Saudi Arabia (6%), Russia (6%) and Columbia (4%).
The U.S. also ranks:
- first in worldwide reserves of coal;
- sixth in worldwide reserves of natural gas;
- eleventh in worldwide reserves of oil.
Figure 2.6.3 shows the worldwide energy flow.
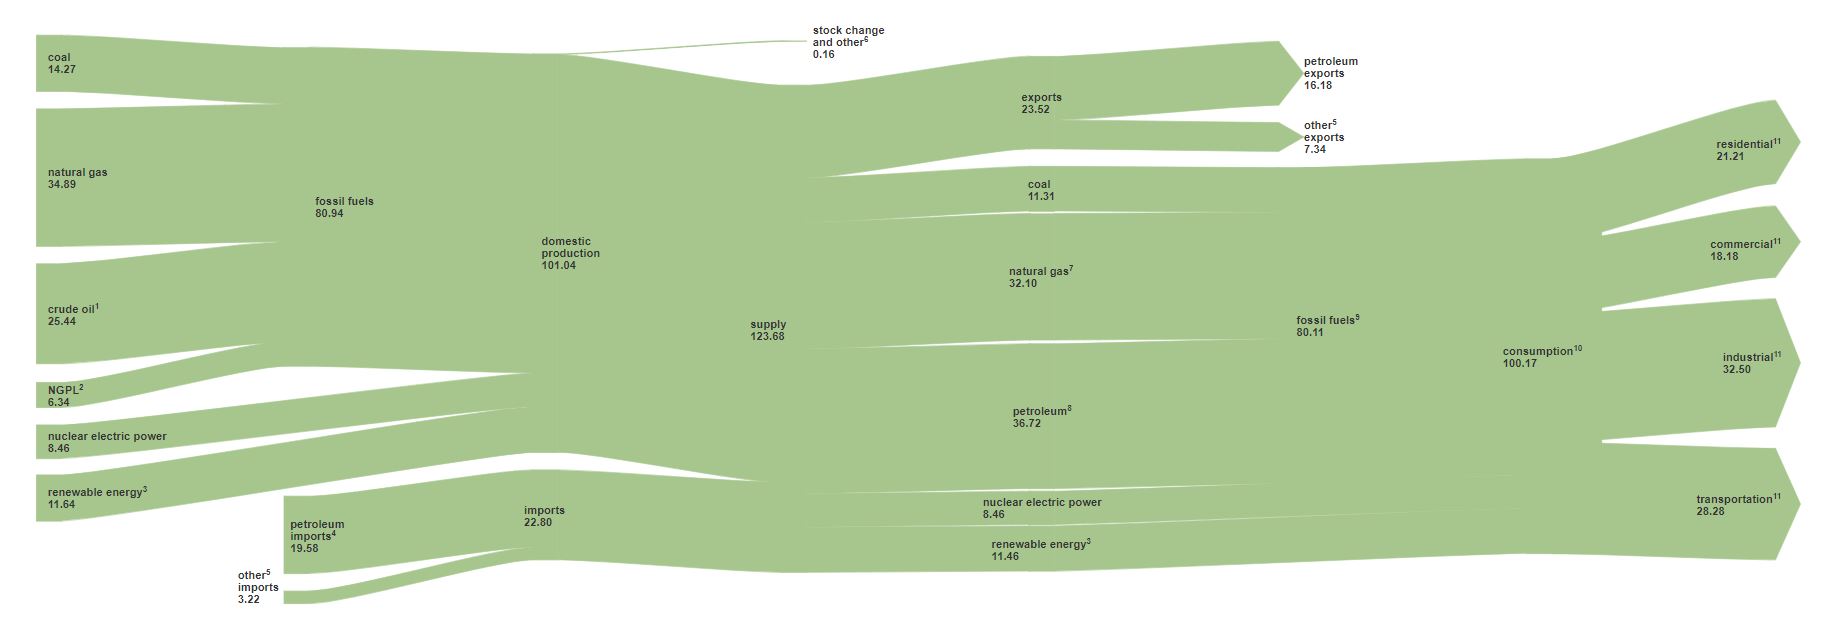
Figure 2.6.3. Total energy flow (quadrillion BTUs) in 2019
Credit: Monthly Energy Review, May 2020
US Energy Consumption by Source and the chart of the U.S. Energy consumption by source and user sector shows each energy source and the amount of energy it supplies in British thermal units (BTU). Petroleum is the leading source of energy in the U.S. in 2019 with 36.72 quadrillion BTUs. Next is natural gas with 32.10 quadrillion BTUs. Coal supplies 11.31 quadrillion BTUs of energy. Renewable energy and nuclear power are responsible for 11.46 and 8.46 quadrillion BTUs respectively. Of the total petroleum consumption, 72% is used for transportation and another 23% is used by the industrial sector. Similarly, 35% of the natural gas (largest fraction) is used for power generation. On the other hand, 76% of the residential and commercial energy needs are met by natural gas.
U.S. Energy Consumption by Source and Sector
The graph shows how dependent the U.S. is on our petroleum supply, as it accounts for almost 37% of our energy. Our next two highest sources of energy, like petroleum, are non-renewable and include natural gas and coal. Only about 11% of our energy comes from renewable energy sources such as wood and water (hydroelectricity). According to Energy Information Administration, U.S. renewable energy consumption surpassed coal for the first time in over 130 years in 2019. Of the 4.12 trillion kWh of electricity generated in the US, 38% was from natural gas, coal accounted for about 23% and nuclear adding another 20%. Renewable sources contributed to 17% of the total electricity generated.
Figure 2.6.4 shows the distribution of energy consumption in the U.S. by sector.

Figure 2.6.4. Graph of U.S. energy consumption by source and use by end sectors
Credit: Energy Review Monthly, May 2020 by EIA
U.S. Energy Consumption over Time
Figure 2.6.5 shows U.S. energy consumption over time.

Figure 2.6.5. U.S. primary energy consumption history (quadrillion BTUs)
Credit: US EIA, Energy Monthly Review June 2016
Figure 2.6.6 focuses on renewable energy sources in the U.S.

Figure 2.6.6. U.S. renewable energy consumption history
Credit: US EIA Energy Review Monthly, June 2016
In 2019, fossil fuels made up 81% of total U.S. energy consumption, the lowest fossil fuel share in the past century. According to EIA projections, the percentage declines to 76.6% by 2040. Policy changes or technology breakthroughs that go beyond the trend improvements could significantly change that projection. In 2019, the renewable share of energy consumption in the United States was its largest since the 1930s at nearly 11.7%. The greatest growth in renewable energy sources over the past decade has been in solar and wind electricity generation. Liquid biofuels have also increased in recent years, contributing to the growing renewable share of total energy consumption.
The most significant decline in recent years has been coal: U.S. coal consumption fell by 41% since 2009 in a decade, from 997 million tons to 587 million tons. Biomass, which includes wood as well as liquid biofuels like ethanol and biodiesel, remain relatively flat, as wood use declines and biofuel use increases slightly. In contrast, wind and solar are among the fastest-growing energy sources in the projection, ultimately surpassing biomass and nuclear, and nearly exceeding coal consumption by 2040.
Figure 2.6.7 compares the energy consumption in 2012 with what is projected in 2035.
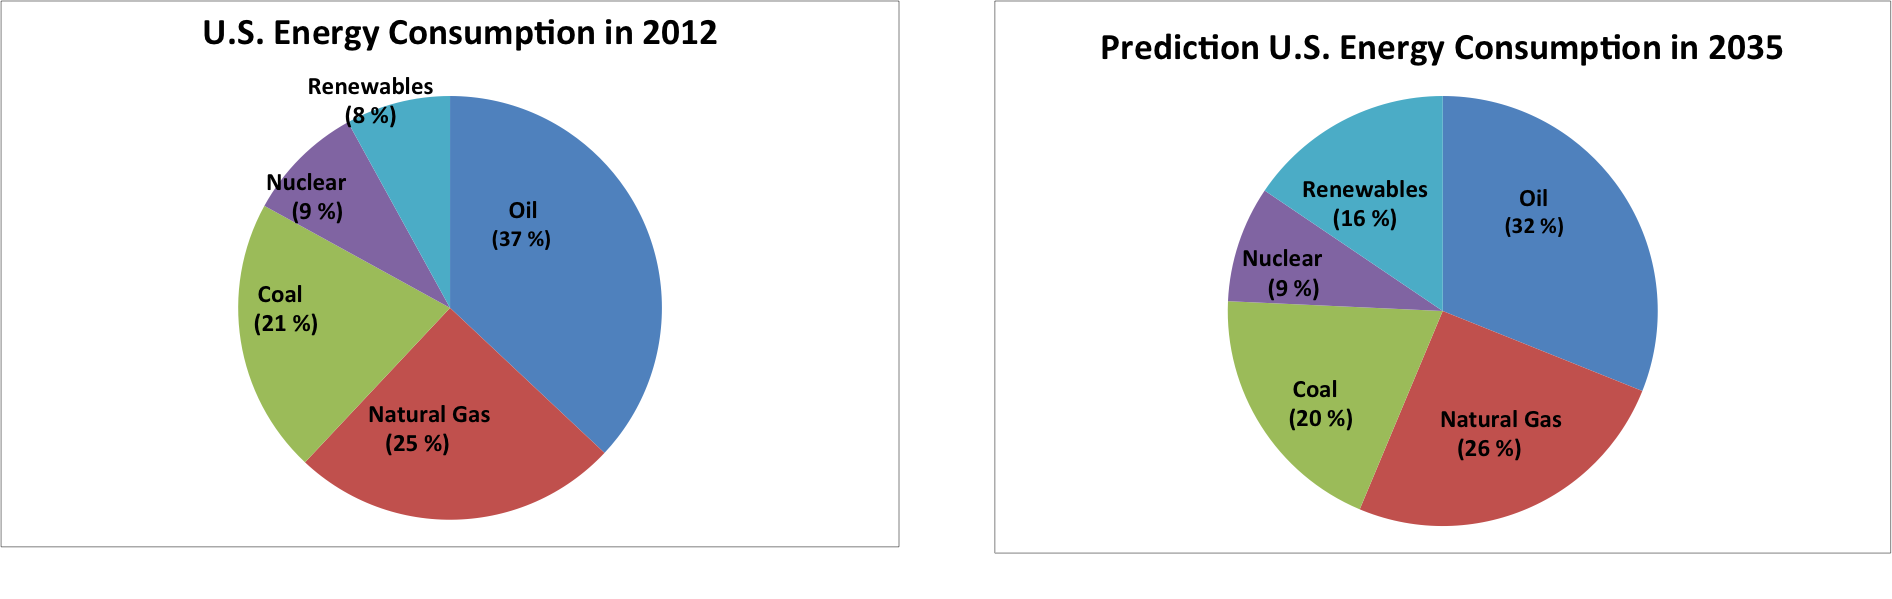
Figure 2.6.7. U.S. energy consumption history
Energy Sources in the U.S. and Their Future Outlook
Table 2.6.1 summarizes the U.S.’s energy sources and their future outlook.
Table 2.6.1. Comparisons of the different types of fossil fuels (the primary energy sources, currently) in the U.S.
| Source | Future Outlook | Advantages/Disadvantages |
|---|---|---|
| Oil | Petroleum demand is projected to grow from 19.17 million barrels per day in 2010 to 19.9 million barrels per day in 2035. | Approximately 72.1% of the petroleum in the U.S. is used for transportation, and about 22.5% is used by the industrial sector. |
| Natural gas | Total dry natural gas production in the U.S. increased by 35% from 2005 to 2013, with the natural gas share of total U.S. energy consumption rising from 23% to 28%. Production growth resulted largely from the development of shale gas resources. In 2009, production stood at 20.65 trillion cubic feet (Tcf), net imports at 2.68 Tcf, and consumption at 22.85 Tcf. The projections for domestic natural gas consumption in 2030 is 26.1 trillion cubic feet per year, as compared with 24.13 trillion cubic feet in 2010. In the reference case, natural gas consumption in the electric power sector is projected to increase from 7.38 trillion cubic feet in 2010 to a peak of 8.08 trillion cubic feet in 2015. Natural gas use in the electric power sector declines after 2020, to 7.87 trillion cubic feet in 2025, as new coal-fired generating capacity displaces natural-gas-fired generation. Continued growth in residential, commercial, and industrial consumption of natural gas is roughly offset by the projected decline in natural gas demand for electricity generation. As a result, overall natural gas consumption is almost flat between 2020 and 2025. |
The EIA forecasts greater dependence on more costly supplies of natural gas, such as imports of Liquefied Natural gas (LNG), and remote resources from Alaska and the Mackenzie Delta in Canada. LNG imports, Alaskan production, and production in the 48 States from nonconventional sources are not expected to increase enough to offset the impacts of resource depletion and increased demand. The industrial sector was the largest consuming sector of natural gas. Production of gas from shale (such as Marcelleus) is likely to change the natural gas usage very quickly. Gas can be converted to oil. New gas to liquid fuel plants in the U.S. are likely to change the oil imports scenario in the next two decades. |
| Coal | Between 2008 and 2013, U.S. coal production fell by 187 million short tons (16%), as declining natural gas prices made coal less competitive as a fuel for generating electricity. U.S. coal production increases at an average rate of 0.7%/year from 2013 to 2030, from 985 million short tons (19.9 quadrillion BTUs) to 1,118 million short tons (22.4 quadrillion BTUs). Over the same period, rising natural gas prices, particularly after 2017, contribute to increases in electricity generation from existing coal-fired power plants as coal prices increase more slowly. After 2030, coal consumption for electricity generation levels off through 2040. |
Compliance with the Mercury and Air Toxics Standards (MATS), coupled with low natural gas prices and competition from renewables, leads to the projected retirement of 31 gigawatts (GW) of coal-fired generating capacity and the conversion of 4 GW of coal-fired generating capacity to natural gas between 2014 and 2016. However, coal consumption in the U.S. electric power sector is supported by an increase in output from the remaining coal-fired power plants, with the projected capacity factor for the U.S. coal fleet increasing from 60% in 2013 to 67% in 2016. In the absence of any significant additions of coal-fired electricity generating capacity, coal production after 2030 levels off as many existing coal-fired generating units reach maximum capacity factors and coal exports grow slowly. Total U.S. coal production remains below its 2008 level through 2040. |
In 2010, domestic supply was 14.72 million barrels per day, and net imports were 9.17 million barrels per day. The trend of increasing U.S. dependence on imported oil in the past decade is expected to continue.
In 2015, the United States imported approximately 9.4 million barrels per day (MMb/d) of petroleum from about 82 countries. Petroleum includes crude oil, natural gas plant liquids, liquefied refinery gases, refined petroleum products such as gasoline and diesel fuel, and biofuels including ethanol and biodiesel. About 78% of gross petroleum imports were crude oil. In 2015, the United States exported about 4.8 MMb/d of petroleum to 136 countries. Most of the exports were petroleum products. The resulting net imports (imports minus exports) of petroleum were about 4.6 MMb/d.
Net U.S. imports of energy declined from 30% of total energy consumption in 2005 to 13% in 2013 and down to 7.6 % in 2017, as a result of strong growth in domestic oil and dry natural gas production from tight formations and slow growth of total energy consumption.
US Energy Consumption History
A pie chart of US energy consumption in 2012 shows the percentage of each type of energy that was consumed for that year. Renewables 8%, nuclear 9%, coal 21%, natural gas 25%, and oil 37%. A second pie chart of the US energy consumption in 2035 shows the prediction of the percentage of each type of energy that will be consumed for that year. Renewables 16%, nuclear 9%, coal 20%, natural gas 26%, and oil 32%. The history of the energy consumption profile of the United States indicates that petroleum makes the largest part of the energy demand over the past seven decades. Natural gas has taken the second over the past decade with the production of gas from shale. Coal is slowly being replaced by natural gas for power generation over the past decade. Renewable energy is growing at a much faster rate. Among the renewable energy sources, biomass has the larger share followed by hydroelectric energy. Wind energy and solar energy are the fastest growing energy sources.
US Vehicle Fuel Consumption
Table 2.6.2 below shows vehicle fuel consumption and travel.
Table 2.6.2. U.S. vehicle fuel consumption and travel from 1960 to 2018 (unless otherwise indicated)
| 1960 | 1970 | 1980 | 1990 | 2000 | 2010 | 2018 | |
|---|---|---|---|---|---|---|---|
| Vehicles registered (thousands)a | 73,858 | 111,242 | 161,490 | 193,057 | 225,821 | 250,070 | 273,602 |
| Vehicle-miles traveled (millions) | 718,762 | 1,109,724 | 1,527,295 | 2,144,362 | R2,746,925 | 2,967,266 | 3,269,088 |
| Fuel consumed (million gallons) | 57,880 | 92,329 | 114,960 | 130,755 | R162,554 | 169,679 | 176,444 (2016) |
| Average miles traveled per vehicle (thousands) | 9.7 | 10.0 | 9.5 | 11.1 | 12.2 | 11.8 | 11.9 |
| Average miles traveled per gallon | 12.4 | 12.0 | 14.9 | 18.8 | 20.0 | 21.5 | 22.3 |
| Average fuel consumed per vehicle (gallons) | 784 | 830 | 712 | 677 | R720 | 678 | 644 |
R = revised, a = includes personal passenger vehicles, buses, and trucks.
Sources:
- 1960-94: U.S. Department of Transportation, Federal Highway Administration, Highway Statistics Summary to 1995, FHWA-PL-97-009 (Washington, DC: July 1997), table VM-201A.
- 1995-2005: Ibid., Highway Statistics (Washington, DC: Annual issues), table VM-1
- U.S. Department of Transportation, Federal Highway Administration, Highway Statistics 2010
Electricity
U.S. electricity generation is expected to grow from 3.7 trillion kWh in 2015 to 4558 kWh in 2035. The webpage US electricity explained - Sources and profiles has more details. Notice, in this webpage,
- Sources of U.S. electricity generation
- Notable changes in the major sources for electricity generation between 1950 and 2019
- Role of renewable energy in the electricity generation
Growth in electricity use for computers, office equipment, and electrical appliances in the residential and commercial sectors is partially offset by improved efficiency in these and other, more traditional electrical applications, by the effects of demand-side management programs, and by slower growth in electricity demand for some applications, such as air conditioning.
Most capacity additions over the next 10 years are natural-gas-fired plants, increasing the natural gas share to 26% and lowering the coal share to 20% in 2035. Nuclear and renewable generation increase as new plants are built stimulated by Federal tax incentives and rising fossil fuel prices. The nuclear generation (about 9 percent of total electricity supply in 2012) is projected to remain at about 9% in 2035. Generation from renewable resources is expected to rise from 8% in 2012 to 16% in 2035.
Additional Information
Demand-side management programs address efficiency. By being more efficient, we can do more with less, and then reduce the demand for energy.