

Chapter 5: Axial Loading
- Page ID
- 145519

\( \newcommand{\vecs}[1]{\overset { \scriptstyle \rightharpoonup} {\mathbf{#1}} } \)
\( \newcommand{\vecd}[1]{\overset{-\!-\!\rightharpoonup}{\vphantom{a}\smash {#1}}} \)
\( \newcommand{\dsum}{\displaystyle\sum\limits} \)
\( \newcommand{\dint}{\displaystyle\int\limits} \)
\( \newcommand{\dlim}{\displaystyle\lim\limits} \)
\( \newcommand{\id}{\mathrm{id}}\) \( \newcommand{\Span}{\mathrm{span}}\)
( \newcommand{\kernel}{\mathrm{null}\,}\) \( \newcommand{\range}{\mathrm{range}\,}\)
\( \newcommand{\RealPart}{\mathrm{Re}}\) \( \newcommand{\ImaginaryPart}{\mathrm{Im}}\)
\( \newcommand{\Argument}{\mathrm{Arg}}\) \( \newcommand{\norm}[1]{\| #1 \|}\)
\( \newcommand{\inner}[2]{\langle #1, #2 \rangle}\)
\( \newcommand{\Span}{\mathrm{span}}\)
\( \newcommand{\id}{\mathrm{id}}\)
\( \newcommand{\Span}{\mathrm{span}}\)
\( \newcommand{\kernel}{\mathrm{null}\,}\)
\( \newcommand{\range}{\mathrm{range}\,}\)
\( \newcommand{\RealPart}{\mathrm{Re}}\)
\( \newcommand{\ImaginaryPart}{\mathrm{Im}}\)
\( \newcommand{\Argument}{\mathrm{Arg}}\)
\( \newcommand{\norm}[1]{\| #1 \|}\)
\( \newcommand{\inner}[2]{\langle #1, #2 \rangle}\)
\( \newcommand{\Span}{\mathrm{span}}\) \( \newcommand{\AA}{\unicode[.8,0]{x212B}}\)
\( \newcommand{\vectorA}[1]{\vec{#1}} % arrow\)
\( \newcommand{\vectorAt}[1]{\vec{\text{#1}}} % arrow\)
\( \newcommand{\vectorB}[1]{\overset { \scriptstyle \rightharpoonup} {\mathbf{#1}} } \)
\( \newcommand{\vectorC}[1]{\textbf{#1}} \)
\( \newcommand{\vectorD}[1]{\overrightarrow{#1}} \)
\( \newcommand{\vectorDt}[1]{\overrightarrow{\text{#1}}} \)
\( \newcommand{\vectE}[1]{\overset{-\!-\!\rightharpoonup}{\vphantom{a}\smash{\mathbf {#1}}}} \)
\( \newcommand{\vecs}[1]{\overset { \scriptstyle \rightharpoonup} {\mathbf{#1}} } \)
\(\newcommand{\longvect}{\overrightarrow}\)
\( \newcommand{\vecd}[1]{\overset{-\!-\!\rightharpoonup}{\vphantom{a}\smash {#1}}} \)
\(\newcommand{\ket}[1]{\left| #1 \right>}\)
\(\newcommand{\bra}[1]{\left< #1 \right|}\)
\(\newcommand{\braket}[2]{\left< #1 \vphantom{#2} \right| \left. #2 \vphantom{#1} \right>}\)
\(\newcommand{\braopket}[3]{\left< #1 \vphantom{#2}\vphantom{#3} \right| #2 \vphantom{#1}\vphantom{#3} \left| #3 \vphantom{#1}\vphantom{#2} \right>}\)
\(\newcommand{\qmvec}[1]{\mathbf{\vec{#1}}}\)
\(\newcommand{\op}[1]{\hat{\mathbf{#1}}}\)
\(\newcommand{\expect}[1]{\langle #1 \rangle}\)
\(\newcommand{\dfn}[1]{\emph{\textbf{#1}}}\)
Learning Objectives
-
Explain stress concentrations and use geometry to calculate maximum stress
-
Calculate axial deformation in a bar subjected to axial load
-
Determine deformation in a series of parallel bars
-
Define statically indeterminate problems and solve them using knowledge of deformation
-
Calculate thermal deformation and solve statically indeterminate problems involving changes in temperature
This chapter takes a closer look at the effects of axial loading. Axial loads are those applied perpendicular to the cross-section of an object (Figure 5.1). Such loads affect the object in several ways.

Figure 5.1: Axial loads act perpendicular to the cross-section. They cause normal stress on the cross-section and normal strains in both the axial (A) and transverse (T) directions.
Axial loads create axial stresses, as seen in Section 2.1 and revisited briefly in Section 5.1. We previously considered the average normal stress in a cross-section, but the geometry of the cross-section can cause large localized stresses much higher than the average. These stress concentrations are discussed in Section 5.2.
This text is concerned with both stress and deformation, so Section 5.3 explores the deformation caused by axial loads. This extends to a special case of axial deformation involving parallel bars in Section 5.4, before we apply our knowledge of axial deformation to solve statically indeterminate problems in Section 5.5. These are problems where the equilibrium equations are insufficient to determine the reaction and internal forces.
Finally we'll investigate the effects of temperature in Section 5.6. As the temperature of an object changes, the object expands or contracts. Thus deformation can occur even in the absence of any applied forces.
5.1 Axial Stress
Axial loads create axial stresses, also known as normal stresses. As discussed in Section 2.1, the average normal stress is calculated from
where
-
σ = Average normal stress [Pa, psi]
-
N = Internal normal force [N, lb]
-
A = Cross-sectional area [m2, in.2]
5.2 Stress Concentrations
5.2.1 Saint-Venant's Principle
The normal stress mentioned in the introductory section is averaged over the cross-section and assumes that stresses (and therefore strains) at the cross-section are uniform. In reality stresses and strains can vary across a cross-section, especially if the cross-section is close to an applied load, a support, or a change in geometry. At these points localized stress concentrations occur, leading to large, localized stresses and strains. The intensity of these concentrations depends on the type of loading, support, or geometry (Figure 5.2).

Figure 5.2: Each bar has a fixed support on the left, a cross-section of 30 in.2, and is subjected to a force of 10,000 lb. The top bar is uniform and experiences a uniform average normal stress of psi at all points, except those close to the support and load. The bottom bar experiences the same stress at most points, but significantly higher stress concentrations close to the hole.
However, these effects disappear a certain distance away from the force, support, or local geometry, so it is acceptable to assume uniform stress and strain (as we have done so far) provided that we also assume our cross-section is a sufficient distance away from these points. This is known as Saint-Venant's principle, which can be formally stated thus: “The stresses and strains created at a point in a body by two statically equivalent loads are equivalent at points sufficiently far removed from the applied load” (Figure 5.3).

Figure 5.3: Two statically equivalent loads applied to a bar. Close to the point of application there will be localized stresses and deformations, but at a cross-section sufficiently far away from the applied loads the internal effects are equivalent.
5.2.2 Stress Concentrations Around Changes in Geometry
More advanced courses use the theory of elasticity to study the areas of variable stress and strain, but for now we'll continue to apply Saint-Venant's principle and assume that our cross-sections are sufficiently far away from the applied loads to eliminate the need to consider these stress concentrations. Here, however, the focus is on the question of stress concentrations around changes in geometry. We'll study two specific examples: holes and fillets. Figure 5.2 shows an example of the stress concentrations around a hole. Figure 5.4 shows an example of the stress concentrations around a fillet, which is a rounded corner used to help transition between two geometries.
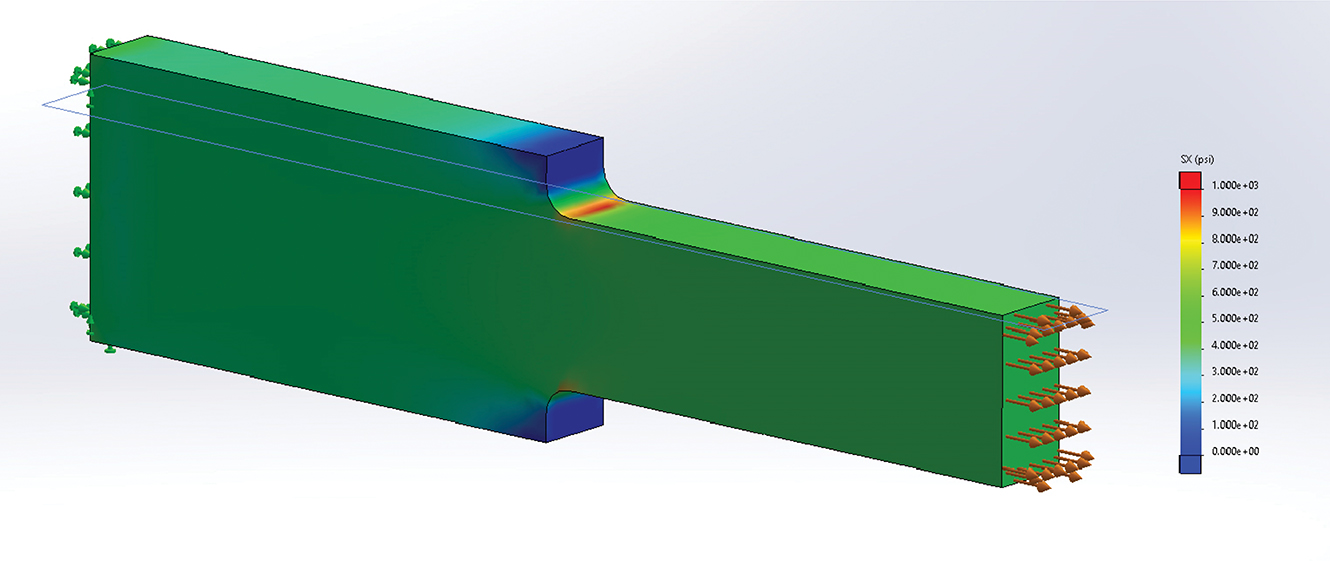
Figure 5.4: The fillet helps prevent a sharp corner but still causes stress concentrations. The bar has a thickness of 3 in. The height of the smaller section is 6 in. and the larger section is 10 in. The applied load is 10,000 kips, so the average normal stress in the smaller section is 556 psi and in the larger section is 333 psi. The maximum stress at the fillet, however, is 973 psi.
Fully modeling these stress concentrations is very complicated, but for our purposes it is sufficient to find only the maximum stress that occurs around these stress concentrations. These can be significantly larger than the average stress we have been calculating and can cause localized failure even if the average stress is below the yield stress for the material. The maximum stress can be found simply by multiplying the average stress by a stress concentration factor, K.
(5.1)
where
-
σmax = Maximum normal stress [Pa, psi]
-
K = Stress concentration factor
-
σavg = Average normal stress [Pa, psi]
This stress concentration factor depends on the geometry at hand and can be found from curves in design handbooks. Figure 5.5 shows curves for holes and fillets. The average normal stress is calculated at whichever plane gives the largest value. For the case with a hole, this is the plane passing through the center of the hole. For the case with a fillet, this is a plane passing through the smaller segment of the member. See Example 5.1 and Example 5.2 to see how these curves can be used.

Figure 5.5: Graphs showing how the stress concentration factor, K, changes according to the geometry of the object.
Example 5.1
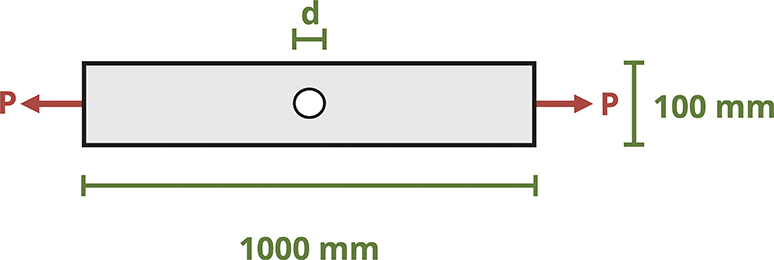
A hole is drilled through a steel plate to allow two components to be bolted together. The plate has the dimensions shown and is 15 mm thick. The plate is subjected to an axial load of P = 50 kN.
Determine the maximum stress in the plate if the hole diameter is d = 20 mm.
Solution
Start by calculating the average normal stress in the plate at the location of the hole. The cross-section is a rectangle with a base of 15 mm (0.015 m) and a height of 100 mm (0.1 m), with a 20 mm (0.02 m) diameter hole cut out.

Determine the ratio , where d = hole diameter and D = height of the cross-section. Use the appropriate stress concentration curve to read off the stress concentration factor K for this geometry.

Calculate the maximum stress.
Example 5.2
A 1 in. thick connecting rod in an engine assembly has the dimensions shown. The maximum allowable stress in the rod is 40 ksi.
Determine the maximum axial load that may be applied to the rod.

Solution
The connecting rod has two holes and a fillet. We can start by determining which of these geometries experiences the largest maximum stress, considering applied load P. For each geometry, calculate the average normal stress and then use the appropriate stress concentration curve to determine the maximum normal stress.
For the smaller circle:

For the larger circle:

For the fillet:

The largest stress is at the small hole, where smax = 1.075P.
Since the maximum allowable stress is 40 ksi,
Apparent from these examples is that sharp corners and tight radii lead to high stress concentrations. When designing parts, it is best to use smooth, flowing transitions where possible and avoid sharp corners to minimize stress concentrations.
Step-by-Step: Stress Concentrations
-
Calculate the average normal stress using . Do this at the hole or at the thinner section of the fillet.
-
Use the appropriate stress concentration curve to determine the stress concentration factor, K, for the given geometry.
-
Calculate the maximum stress from
5.3 Axial Deformation
Consider a simple bar of uniform cross-section subjected to an axial force (Figure 5.6).

Figure 5.6: A bar of uniform cross-section, A, and length, L, subjected to axial load, F.
Assuming elastic behavior, we have equations for stress and strain, as well as Hooke's law, which relates the two equations.
Replace the stress and strain terms in Hooke's law.
Rearrange the equation.
This last equation can be used to directly find the change in length of an object subjected to an axial load.
In practice multiple axial loads may be applied to the bar. The cross-sectional area may change at different points along the bar, or perhaps different materials with different elastic moduli are connected in series to form the bar. In any of these cases we can split the bar into sections where each section has a constant F, A, and E. We can calculate the change in length of each section separately and sum them to find the total. See Example 5.3 for deformation of a simple bar subjected to a single load and Example 5.4 for a problem involving multiple segments of a bar.
(5.2)
where
-
∆L = Change in length [m, in.]
-
F = Internal axial load [N, lb]
-
L = Original length [m, in.]
-
A = Cross-sectional area [m2, in.2]
-
E = Elastic modulus [Pa, psi]
Example 5.3
A wooden beam (E = 12 GPa) of length L = 6 m has a rectangular cross-section of base b = 50 mm and height h = 80 mm. The beam is subjected to a tensile load P = 30 kN as shown.
Determine the change in length of the beam.

Solution
We can find the change in length of the beam using .
Here only one load is applied and the beam is made of a single material with a uniform cross-section, so F, A, and E are constant.
We next find the internal load in the beam by cutting a cross-section and drawing a free body diagram (FBD).
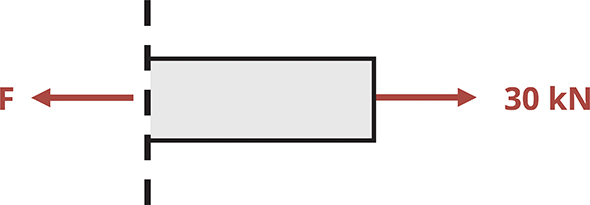
The beam has a rectangular cross-section so the area is given by
We are given L = 6 m and E = 12 GPa, so the change in length of the beam is given by
The beam lengthens by 3.75 mm.
Example 5.4
A component is made by welding together two circular rods. Rod 1 is made of steel (E = 29 x 106 psi) and is hollow, with an outer diameter of 4 in. and an inner diameter of 2 in. Rod 2 is made of copper (E = 17 x 106 psi) and is solid, with a diameter of 5 in.
If the component is subjected to the axial loads shown, determine the total deformation of the component.

Solution
We can find the change in length of the component using .
First, break the component into three segments and determine the internal load in each segment. The first segment covers the 9 in. steel rod. After the first 9 in. of the component, both the cross-sectional area and elastic modulus change, so a second segment is needed. This segment covers the next 4 in. At this point the loading changes, so a third segment is required to cover the final 10 in. of the component.

Now calculate the deformation of each segment. Be sure to use the appropriate dimensions and material properties for each segment.
Cross-sectional areas:
Deformation of segment 1:
Deformation of segment 2:
Deformation of segment 3:
Note that segment 3 is in compression and therefore becomes shorter, while segments 1 and 2 are in tension and therefore become longer. The total deformation in the component is simply the sum of these three deformations.
Step-by-Step: Axial Deformation
-
Split the bar into sections of constant F, A, and E. Any time any term changes, begin a new section.
-
Determine the length of each section.
-
Calculate the change in length of each section using
-
Determine the total change in length by summing the change in length of each section. Remember that some sections may elongate while others contract.
5.4 Deformation in Series of Bars
Sometimes a structure has more than one axially loaded member. In such cases multiple bars will experience a change in length and the amount of deformation won't necessarily be the same in each member. The deformable members are generally connected by a rigid (nondeformable) beam. These problems generally involve a little geometry alongside the deformation equation (Figure 5.7).

Figure 5.7: Rigid beam AB is attached to deformable poles 1 and 2. The poles may deform different amounts, so point A is displaced by amount DL1, point B by amount DL2, and point C by an amount in between these two values.
By identifying the force in each member through equilibrium, we may calculate the deformation of each member separately by using
Once each member's change in length is known, use simple geometry to find the displacement at different points on the rigid beam (Figure 5.8). This process is demonstrated in Example 5.5.

Figure 5.8: Beam deflection in the case where only bar 2 deforms. Point B will deflect downward by amount ∆L2. The deflection at point C can be determined through geometry.
The deflection of point C will be somewhere between the deflection at A and the deflection at B. Assuming that there is no deflection at A and that the deflections (and thus the angle at A) are small, use similar triangles to find
If a deflection exists at point A (Figure 5.9), this simply becomes

Figure 5.9: Similar triangles for calculating deflection at a point when both bars experience a change in length.
Example 5.5
A rigid beam is supported by two nonrigid poles and subjected to a distributed load w = 75 kN/m. Pole 1 is made of steel (E = 200 GPa) and has a diameter of 30 mm. Pole 2 is made of cast iron (E = 70 GPa) and has a diameter of 50 mm.
Determine the deflection at point C of the rigid beam.

Solution
Although the beam is rigid, poles 1 and 2 will both elongate. We can find the force in each pole by drawing an FBD and applying equilibrium equations.

We can then calculate each pole's change in length.
To determine the deflection at point C, first determine that point B has deflected: (8.73 mm −7.07 mm) = 1.66 mm more than point A.

We can find how much more point C has deflected than point A by using similar triangles.

So point C deflects 0.553 mm more than point A, which is a total deflection at point C of
Step-by-Step: Deformation in Series of Bars
-
Use equilibrium to determine the internal force in each bar.
-
Calculate the change in length of each bar using .
-
Use similar triangles to find the deflection at any point between the parallel bars.
5.5 Statically Indeterminate Problems
A statically indeterminate problem is one that has more unknowns than we have equilibrium equations to solve for them. This issue prevents us from finding the internal loads, and so we cannot calculate stress or deformation.
There are two types of statically indeterminate problems. The first type has additional supports beyond those needed to maintain equilibrium. These are known as redundant supports and are quite common in practice (Figure 5.10).
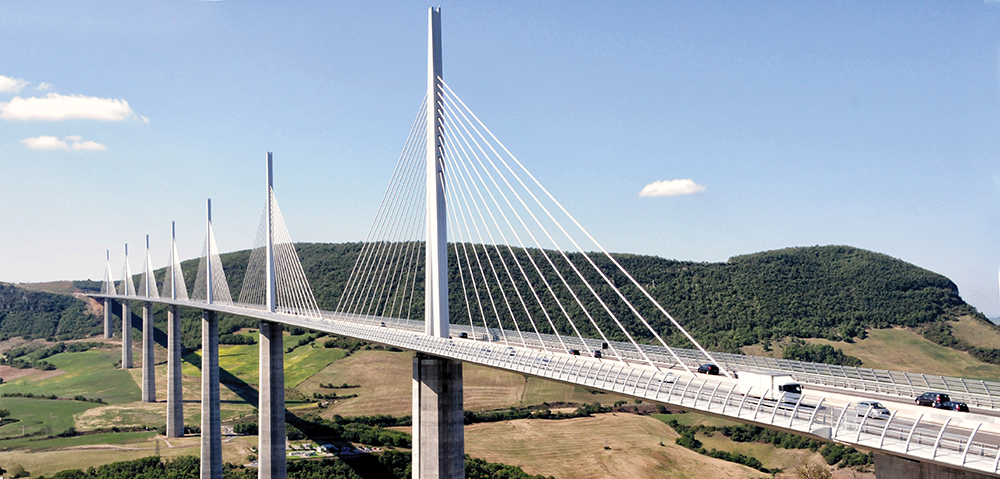
Figure 5.10: An example of redundancy on a suspension bridge. There are multiple supports and multiple cables at each support, such that if one cable fails the entire structure does not collapse.
In such problems, determining all the reaction forces using equilibrium alone isn't possible. However, we can use our knowledge of deformation to help. If a member is held between two supports, then its total deformation must be zero. Since the change in length depends on the internal force in the member, this constraint introduces an additional equation to use alongside the equilibrium equations. Two approaches are possible here.
Approach 1: To determine the reaction force at the redundant support, begin by removing the redundant support from the problem and determining the deformation that would occur without the support. Then replace the reaction force at the support, which will cause the member to deform in the opposite direction (Figure 5.11).

Figure 5.11: (a) A bar held between two rigid supports. (b) A free body diagram of the beam reveals that there are two unknowns but only one equilibrium equation. (c) Removing one of the supports allows the bar to elongate. (d) Replacing the support force causes the bar to contract.
The sum of these two deformations must equal the member's actual deformation. If the member is held between two rigid supports, the total deformation will be zero. If there is a small gap or the supports allow a certain amount of movement, the total deformation will be equal to the size of this gap. Example 5.6 shows this process applied to a bar made of two materials.
Example 5.6
A 15 ft tall concrete (E = 4,000 ksi) column has a square cross-section of 6 in. × 6 in. A 10 ft tall copper (E = 17,000 ksi) cylinder with an outer diameter of 4 in. and inner diameter of 3 in. is attached to the top of the concrete. The structure is fixed between two supports. A force of 25 kips is applied as shown.
Determine the average normal stress in each material.

Solution
To determine the internal force in each material, first find the reaction forces at the supports. Usually we draw an FBD and apply equilibrium equations to find these forces. However, this won't work here because the problem is statically indeterminate.

To solve this statically indeterminate problem, remove one of the supports and allow the structure to deform. Either support may be removed.
Remove the top support. In this scenario there is no load in the copper cylinder and there is a compressive load of 25 kips in the concrete column.

The total deformation of the structure in this scenario is
Then replace force F1 and calculate the deformation caused by this force. Because force is applied at the top of the structure, both the concrete and the copper elongate.

Since the structure is fixed at both ends, the actual total deformation must be zero.
Returning to the equilibrium equation, also find force F2.
The internal force in the copper cylinder is 12.3 kips, and the internal force in the concrete column is 12.7 kips. Finally, calculate the stress in each material. Note from your original FBD that the copper cylinder is in tension and the concrete column is in compression. Introduce a negative sign here to indicate compressive stress in the concrete.
Approach 2: An alternative approach is to start by noting that the total deformation of the bar must be zero. In the case shown in Figure 5.12, the deformation of segment 1 plus the deformation of segment 2 must add up to zero.

Figure 5.12: (a) A bar held between two rigid supports. (b) A free body diagram of the bar.
The internal load in segment 1 is FA and the internal load in segment 2 is FB, so there are currently two unknowns. We may use an equilibrium equation to solve for these two unknowns simultaneously.
Example 5.7 solves Example 5.6 using this method instead.
Example 5.7
A 15 ft tall concrete (E = 4,000 ksi) column has a square cross-section of 6 in. x 6 in. A 10 ft tall copper (E = 17,000 ksi) cylinder with an outer diameter of 4 in. and inner diameter of 3 in. is attached to the top of the concrete. The structure is fixed between two supports. A force of 25 kips is applied as shown.
Determine the average normal stress in each material.

Solution
As before, begin with an equilibrium equation that relates the support loads to the applied load. In this equation we use the convention that forces pointing upward are positive and those pointing downward are negative.

This bar consists of two segments: the copper cylinder (segment 1) and the concrete column (segment 2). Since the bar is held between two rigid supports, the total deformation of these two segments must sum to zero. Note that in this diagram segment 1 is in tension and segment 2 is in compression. Remember to be consistent with the sign convention that tension is positive and compression is negative.
Here F1 and F2 are the internal forces in segments 1 and 2 of the bar. These will be the same as the reaction loads at the supports that we are trying to solve for.
Rearrange the equilibrium equation and substitute into the deformation equation.
Simplify and solve for force F2.
Then use the equilibrium equation again to find F1.
These are the same reactions found in Example 5.6 when we solved this problem using the other approach. From here find the stress in each material as before, noting again from the diagram that segment 2 is in compression.
The second type of indeterminate problem involves two materials bonded together in parallel. In these problems it is possible to find the reactions at the supports, but not possible to find the internal force in each material using only equilibrium (Figure 5.13).

Figure 5.13: When two materials in parallel are subjected to force F, the force is split between the two materials (F1 and F2). By equilibrium F1 + F2 = F, but this is not sufficient to find the force in each material.
We have one equilibrium equation but two unknown internal forces. However, since the materials are bonded together, they must deform by the same amount. By setting the deformation the same for each material, we can define a second equation that involves the two internal forces and, combined with the equilibrium equation, now solve for both internal forces. See Example 5.8 for a demonstration.
Example 5.8
A 20 ft tall concrete (E = 4,000 ksi) column has a square cross-section 6 in. on each side. It is reinforced by six pieces of steel (E = 30,000 ksi) rebar that extend through the column's length. Each has a diameter of 0.5 in. The column is subjected to a compressive load of 70 kips.
Determine the stress in each material.

Solution
The 70 kips force will be split between the two materials. We need to find the force in each material before we can calculate the stress. Start by cutting a cross-section through the column, drawing an FBD, and writing an equilibrium equation.
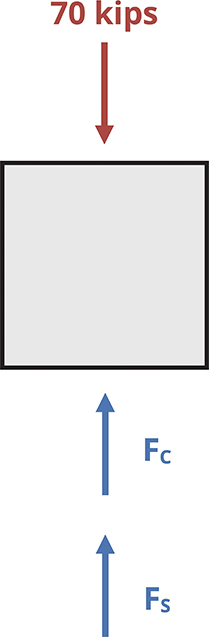
This problem is statically indeterminate, since we have two unknowns and only one equilibrium equation. However, because the two materials are bonded together, they must both deform the same amount.
Since we know ,
The length of both materials is 20 ft, so this term will cancel.
Although the steel comprises six individual pieces, it is fine to determine the total area of the steel and the total force in the steel. The total area of the steel is
For the area of the concrete, calculate the area of the square and then remove the area of the six rebar rods.
Substitute these into the deformation equation and rearrange.
Substitute this into the equilibrium equation.
Then since
Now that we know the force in each material, calculate the stress in each material.
Step-by-Step: Statically Indeterminate Axial Problems
Problems with redundant supports
Approach 1:
-
Write out equilibrium equations. There will be too many unknowns, so put these to one side for now.
-
Remove one of the supports and calculate the amount of deformation that would occur if the support were not there, using
-
Replace the force from the removed support and determine the deformation, , caused by this force in terms of the force itself.
-
Set equal to the total allowed deformation for the bar and use this to solve for the unknown force at the redundant support.
-
Now that one force is known, use the equilibrium equations to determine the other unknown forces.
Approach 2:
-
Draw an FBD of the entire structure and write out the relevant equilibrium equations. For axial loads this will be just one sum of force equation, either horizontal or vertical depending on the applied loading.
-
Write an equation in which the total deformation in each segment of the bar must sum to the total deformation of the bar (zero if the bar is held between two rigid supports). A new segment must be made any time the internal load, cross-sectional area, or material changes.
-
This deformation equation involves the same two unknowns as the equilibrium equation. Solve these equations simultaneously to find the reaction loads at the supports.
Problems with two materials in parallel
-
Cut a cross-section through the member and set up an equilibrium equation for the internal forces where the internal forces will sum to equal the external applied force.
-
Set the deformation of the two materials equal.
-
Solve the deformation equation and equilibrium equation simultaneously to determine the internal force in each material.
5.6 Thermal Deformation and Thermal Stresses
So far we've studied the effects of axial forces on an object and how they create stresses and deformations. Temperature changes will also cause an object to deform. As seen in Section 4.6, the strain due to temperature can be predicted by
As before, strain is dimensionless. The coefficient of thermal expansion is a material constant that can be looked up in handbooks or in Appendix C. Note that for a given change in temperature, the thermal strain will be the same in the axial and transverse directions.
Since strain is also defined as , we can also predict the deformation resulting from a change in temperature.
That the object is free to expand or contract doesn't cause any issues and is easy to account for. Many real applications include a small gap to allow for changes in length due to temperature changes (Figure 5.14). It is even possible that an object is subjected to both a physical force and a temperature change and that the total change in length is simply the sum of these effects.

Figure 5.14: Expansion joint on a bridge, allowing for thermal expansion and contraction of the bridge as temperature changes through the year.
(5.3)
where
-
∆L = Change in length [m, in.]
-
∆LF = Change in length due to applied load [m, in.]
-
∆LT = Change in length due to temperature change [m, in.]
-
F = Internal force [N, lb]
-
L = Original length [m, in.]
-
A = Original cross-sectional area [m2, in.2]
-
E = Elastic modulus [Pa, psi]
-
α = Coefficient of thermal expansion
-
∆T = Change in temperature [°C, °F]
However, if we do not design a gap, or if the gap isn't large enough, then the object is not free to expand or contract. As the member pushes or pulls on its supports, a physical force is created. This in turn creates a stress in the object, and these stresses can be very large. Such problems are statically indeterminate because the force the support applies on the member is unknown and cannot be found using only equilibrium.
Solving these problems is very similar to solving the first type of statically indeterminate problem. First, remove a support and determine the amount of deformation that would occur as a result of the change in temperature if the object were free to deform. Then replace the force from the removed support, which will cause the object to deform in the other direction. The sum of these two deformations will equal the total deformation of the member as before. Example 5.9 works through a statically indeterminate thermal expansion problem.
Example 5.9
Steel (E = 200 GPa, α = 11.7 × 10⁻⁶/°C) train rails are laid end-to-end. Each rail is 20 m long. A small section of this track is shown below. The rails are laid in winter when the temperature is 0°C. In summer, the maximum temperature is 40°C.
Determine the compressive stress in the rail as a result of the temperature change if
-
In a particular section of track, the rails are laid with no gap between them.
-
In another section, the rails have a 5 mm gap between them.

Solution
-
First determine the deformation of each rail that would occur if it were free to expand.
Since each rail contacts the rail next to it as it tries to expand, each rail will experience a compressive force. This force causes compression in the rail.
The actual deformation of each rail must be zero, given that the rails are in contact end-to-end. Thus these deformations must sum to zero.
Although we don't know the cross-sectional area of the rail, we can replace
-
In this case again begin by determining the deformation of each rail that would occur if it were free to expand.
Each rail would expand 9.36 mm, but the gap between rails is only 5 mm, so the rails close this gap and make contact, which means there will again be some compressive stress. Set up the deformation equation as in part (a), but this time the deformation is 5 mm (0.005 m) instead of zero.
Replace as before and determine the stress.
We can see that installing the rails with a small gap has significantly reduced the thermal stress. Accurately predicting the amount of deformation and leaving a suitably sized gap would reduce the stress even further.
Step-by-Step: Thermal Deformation
-
Remove one of the supports and calculate the total deformation that would occur if the support were not there, using for thermal deformation and for any applied axial loads.
-
If the total deformation causes the member to contact a support that prevents some of the deformation, replace the force from the removed support and determine the deformation caused by this force in terms of the force itself, using .
-
Sum these deformations and set them equal to the total allowed deformation. Use this equation to solve for the force at the redundant support.
-
Use equilibrium to determine the force at any other supports.
Summary
Key Takeaways
Axial loads cause normal stresses. While we generally calculate the average normal stress, stress concentrations occur close to applied loads, supports, and changes in geometry.
These stress concentrations can be large and cause localized failure even if the average stress is within acceptable limits. Modeling stress concentration is beyond the scope of this course, but we can determine maximum stresses for different geometries using stress concentration curves.
It is often desirable to limit the total change in length of a bar subjected to axial loads. Change in length can be predicted directly.
Leaving a gap to allow for change in length is useful in practice. If a change in length is prevented from happening, this creates a stress in the bar.
Changes in temperature also cause axial deformation of a bar, known as thermal deformation. Thermal deformation can lead to a physical stress in the bar if a support prevents the deformation from occurring.
Key Equations
Stress concentrations:
Axial deformation:
Thermal strain:
Thermal deformation:
References
Figures
All figures in this chapter were created by Kindred Grey in 2025 and released under a CC BY license, except for
-
Figure 5.2: Each bar has a fixed support on the left, a cross-section of 30 in.2, and is subjected to a force of 10,000 lb. James Lord. 2024. CC BY.
-
Figure 5.4: The fillet helps prevent a sharp corner but still causes stress concentrations. James Lord. 2024. CC BY.
-
Figure 5.5: Graphs showing how the stress concentration factor, K, changes according to the geometry of the object. Adapted under fair use by Kindred Grey from Figures 5.14 and 5.15 in Philpot, T.A. (2020) Mechanics of Materials, 4th Edition, Wiley.
-
Example 5.1: First and second image: Kindred Grey. 2024. CC BY. Third image: Adapted under fair use by Kindred Grey from Figures 5.14 and 5.15 in Philpot, T.A. (2020) Mechanics of Materials, 4th Edition, Wiley.
-
Example 5.2: First image: Kindred Grey. 2024. CC BY. Second, third, and fourth image: Adapted under fair use by Kindred Grey from Figures 5.14 and 5.15 in Philpot, T.A. (2020) Mechanics of Materials, 4th Edition, Wiley.
-
Figure 5.10: An example of redundancy on a suspension bridge. Unknown author. 2017. Public domain. https://pxhere.com/en/photo/759379.
-
Figure 5.14: Expansion joint on a bridge, allowing for thermal expansion and contraction of the bridge as temperature changes through the year. James Lord. 2024. CC BY.