
Chapter 9: Analysis of Variance (ANOVA)
- Page ID
- 99733
\( \newcommand{\vecs}[1]{\overset { \scriptstyle \rightharpoonup} {\mathbf{#1}} } \)
\( \newcommand{\vecd}[1]{\overset{-\!-\!\rightharpoonup}{\vphantom{a}\smash {#1}}} \)
\( \newcommand{\dsum}{\displaystyle\sum\limits} \)
\( \newcommand{\dint}{\displaystyle\int\limits} \)
\( \newcommand{\dlim}{\displaystyle\lim\limits} \)
\( \newcommand{\id}{\mathrm{id}}\) \( \newcommand{\Span}{\mathrm{span}}\)
( \newcommand{\kernel}{\mathrm{null}\,}\) \( \newcommand{\range}{\mathrm{range}\,}\)
\( \newcommand{\RealPart}{\mathrm{Re}}\) \( \newcommand{\ImaginaryPart}{\mathrm{Im}}\)
\( \newcommand{\Argument}{\mathrm{Arg}}\) \( \newcommand{\norm}[1]{\| #1 \|}\)
\( \newcommand{\inner}[2]{\langle #1, #2 \rangle}\)
\( \newcommand{\Span}{\mathrm{span}}\)
\( \newcommand{\id}{\mathrm{id}}\)
\( \newcommand{\Span}{\mathrm{span}}\)
\( \newcommand{\kernel}{\mathrm{null}\,}\)
\( \newcommand{\range}{\mathrm{range}\,}\)
\( \newcommand{\RealPart}{\mathrm{Re}}\)
\( \newcommand{\ImaginaryPart}{\mathrm{Im}}\)
\( \newcommand{\Argument}{\mathrm{Arg}}\)
\( \newcommand{\norm}[1]{\| #1 \|}\)
\( \newcommand{\inner}[2]{\langle #1, #2 \rangle}\)
\( \newcommand{\Span}{\mathrm{span}}\) \( \newcommand{\AA}{\unicode[.8,0]{x212B}}\)
\( \newcommand{\vectorA}[1]{\vec{#1}} % arrow\)
\( \newcommand{\vectorAt}[1]{\vec{\text{#1}}} % arrow\)
\( \newcommand{\vectorB}[1]{\overset { \scriptstyle \rightharpoonup} {\mathbf{#1}} } \)
\( \newcommand{\vectorC}[1]{\textbf{#1}} \)
\( \newcommand{\vectorD}[1]{\overrightarrow{#1}} \)
\( \newcommand{\vectorDt}[1]{\overrightarrow{\text{#1}}} \)
\( \newcommand{\vectE}[1]{\overset{-\!-\!\rightharpoonup}{\vphantom{a}\smash{\mathbf {#1}}}} \)
\( \newcommand{\vecs}[1]{\overset { \scriptstyle \rightharpoonup} {\mathbf{#1}} } \)
\(\newcommand{\longvect}{\overrightarrow}\)
\( \newcommand{\vecd}[1]{\overset{-\!-\!\rightharpoonup}{\vphantom{a}\smash {#1}}} \)
\(\newcommand{\avec}{\mathbf a}\) \(\newcommand{\bvec}{\mathbf b}\) \(\newcommand{\cvec}{\mathbf c}\) \(\newcommand{\dvec}{\mathbf d}\) \(\newcommand{\dtil}{\widetilde{\mathbf d}}\) \(\newcommand{\evec}{\mathbf e}\) \(\newcommand{\fvec}{\mathbf f}\) \(\newcommand{\nvec}{\mathbf n}\) \(\newcommand{\pvec}{\mathbf p}\) \(\newcommand{\qvec}{\mathbf q}\) \(\newcommand{\svec}{\mathbf s}\) \(\newcommand{\tvec}{\mathbf t}\) \(\newcommand{\uvec}{\mathbf u}\) \(\newcommand{\vvec}{\mathbf v}\) \(\newcommand{\wvec}{\mathbf w}\) \(\newcommand{\xvec}{\mathbf x}\) \(\newcommand{\yvec}{\mathbf y}\) \(\newcommand{\zvec}{\mathbf z}\) \(\newcommand{\rvec}{\mathbf r}\) \(\newcommand{\mvec}{\mathbf m}\) \(\newcommand{\zerovec}{\mathbf 0}\) \(\newcommand{\onevec}{\mathbf 1}\) \(\newcommand{\real}{\mathbb R}\) \(\newcommand{\twovec}[2]{\left[\begin{array}{r}#1 \\ #2 \end{array}\right]}\) \(\newcommand{\ctwovec}[2]{\left[\begin{array}{c}#1 \\ #2 \end{array}\right]}\) \(\newcommand{\threevec}[3]{\left[\begin{array}{r}#1 \\ #2 \\ #3 \end{array}\right]}\) \(\newcommand{\cthreevec}[3]{\left[\begin{array}{c}#1 \\ #2 \\ #3 \end{array}\right]}\) \(\newcommand{\fourvec}[4]{\left[\begin{array}{r}#1 \\ #2 \\ #3 \\ #4 \end{array}\right]}\) \(\newcommand{\cfourvec}[4]{\left[\begin{array}{c}#1 \\ #2 \\ #3 \\ #4 \end{array}\right]}\) \(\newcommand{\fivevec}[5]{\left[\begin{array}{r}#1 \\ #2 \\ #3 \\ #4 \\ #5 \\ \end{array}\right]}\) \(\newcommand{\cfivevec}[5]{\left[\begin{array}{c}#1 \\ #2 \\ #3 \\ #4 \\ #5 \\ \end{array}\right]}\) \(\newcommand{\mattwo}[4]{\left[\begin{array}{rr}#1 \amp #2 \\ #3 \amp #4 \\ \end{array}\right]}\) \(\newcommand{\laspan}[1]{\text{Span}\{#1\}}\) \(\newcommand{\bcal}{\cal B}\) \(\newcommand{\ccal}{\cal C}\) \(\newcommand{\scal}{\cal S}\) \(\newcommand{\wcal}{\cal W}\) \(\newcommand{\ecal}{\cal E}\) \(\newcommand{\coords}[2]{\left\{#1\right\}_{#2}}\) \(\newcommand{\gray}[1]{\color{gray}{#1}}\) \(\newcommand{\lgray}[1]{\color{lightgray}{#1}}\) \(\newcommand{\rank}{\operatorname{rank}}\) \(\newcommand{\row}{\text{Row}}\) \(\newcommand{\col}{\text{Col}}\) \(\renewcommand{\row}{\text{Row}}\) \(\newcommand{\nul}{\text{Nul}}\) \(\newcommand{\var}{\text{Var}}\) \(\newcommand{\corr}{\text{corr}}\) \(\newcommand{\len}[1]{\left|#1\right|}\) \(\newcommand{\bbar}{\overline{\bvec}}\) \(\newcommand{\bhat}{\widehat{\bvec}}\) \(\newcommand{\bperp}{\bvec^\perp}\) \(\newcommand{\xhat}{\widehat{\xvec}}\) \(\newcommand{\vhat}{\widehat{\vvec}}\) \(\newcommand{\uhat}{\widehat{\uvec}}\) \(\newcommand{\what}{\widehat{\wvec}}\) \(\newcommand{\Sighat}{\widehat{\Sigma}}\) \(\newcommand{\lt}{<}\) \(\newcommand{\gt}{>}\) \(\newcommand{\amp}{&}\) \(\definecolor{fillinmathshade}{gray}{0.9}\)Here you can find a series of pre-recorded lecture videos that cover this content: https://youtube.com/playlist?list=PLSKNWIzCsmjAKitWVYeIIBT_Ktyi3DKhT&si=ovUKlw6lauQFoz6E
ANOVA
You may have heard of ANOVA analysis in some engineering or even more likely in the biological context. ANOVA is analysis of variance and it is an extremely useful statistical analytical tool.
ANOVA is particularly useful in experimental designs where there are multiple variables being varied simultaneously to see if they will have an effect on the measured outcome of the experiment. For example, perhaps I am creating a new high strength alloy and I want to design the new alloy material to maximize the ultimate tensile strength. I can vary a number of parameters when processing this material such as annealing time, solute concentration, amount of work hardening, and many more parameters. One question you may want to answer is do any of these variables have a statistically significant effect on the ultimate tensile strength? Which parameter has the largest effect the ultimate tensile strength? Are there factors that have a combined effect?
Some of these questions we can answer using the tools we know about but others are not as easy to answer. So, before we jump into the deep end so to speak let’s start with developing a solid foundation and build a framework to analyze one a single variable and perform a One-Way ANOVA.
One-Way ANOVA
Let us consider that we run an experiment with k independent random samples from k different populations and there will be a number of observations of measurands y and we can classify them as yij where i will vary from 1−k and j will simply indicate the number of observations. Therefore we will have k number of means yk.
Now in this analysis there are several critical values that we will need to calculate the first of which is the sum of all of some general observation for a some treatment/variable/parameter/etc, i.e. a
\begin{equation}
T = \sum_{i=1}^{k} \sum_{j=1}^{n_i} y_{ij}
\end{equation}
where ni is the number of observations/measurements. Also the total sample size N is
\begin{equation}
N = \sum_{i=1}^{k} n_i
\end{equation}
The overall sample mean will then be simply
\begin{equation}
\overline{y} = \frac{T}{N}
\end{equation}
The sum of squares (SS) for is defined as
\begin{equation}
SS_a = \sum_{i=1}^{k} n_i(\overline{y_i}-\overline{y})^2
\end{equation}
and a critically important measure, the error sum of squares is defined as
\begin{equation}
ESS_a = \sum_{i=1}^{k} \sum_{j=1}^{n_i} (y_{ij}-\overline{y_i})^2
\end{equation}
The degrees of freedom
\begin{equation}
df_a =\sum_{i=1}^{k} n_i -1 = k-1 + \sum_{i=1}^{k} n_i-k
\end{equation}
The mean square can be defined as
\begin{equation}
\frac{SS_a}{df_a}
\end{equation}
and the F ratio for treatments can be defined as
\begin{equation}
F_a = \frac{\frac{SS_a}{(k-1)}}{\frac{ESS_a}{N-k}}
\end{equation}
The F ratio is a key parameter in performing ANOVA analysis as a larger F ratio value will indicate large differences between sample means and thus large differences between samples.
Finally, we will also obtain our P-value in this analysis as well.
We can summarize these key values that we must calculate when performing an ANOVA analysis in what we will typically read in our ANOVA table which we will see when we do some examples to come.
Let’ go ahead and perform a One-Way ANOVA analysis for an example of crop yields as a function of type of fertilizer, crop density, and the location of where the crop has been planted. For a One-Way ANOVA analysis let us first just examine the effect of fertilizer and we can obtain our ANOVA table below
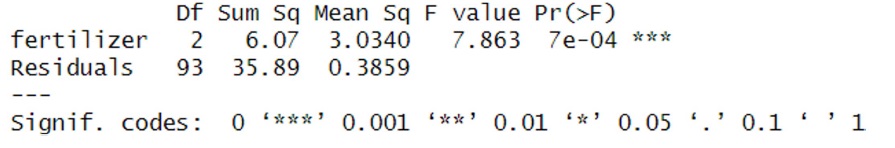
Figure \(\PageIndex{1}\): R ANOVA Table Results.
Here we can see that the p-value is less than 0.05 and therefore we can conclude that fertilizer type has a statistically significant effect on the crop yield. W
Often times we want to go beyond the results from our ANOVA table and perform a post-hoc test. We can use this to go deeper into the data and specifically to see if we have differences between sub-types of fertilizer. One of the most common tests you may come across is a Tukey post-hoc test but this assumes that variances are equal so to be more general we will instead perform a Games Howell post-hoc test!!
Here we can see some very interesting details here. Looking at the p-value there is no statistically significant difference between fertilizer types 1 and 2 whereas there are statistically significant differences between 1 and 3 and 2 and 3!! This is a fantastic insight to observe as it can allow an experimentalist to design new experiments and explore new parameter spaces that yield new exciting results.

Figure \(\PageIndex{2}\): Games Howell Post-Hoc Test.
One of the other extremely valuable pieces of information that we can obtain from ANOVA analysis is not only if there are statistically significant differences due to a parameter but we can also determine if the parameter has a large effect on the outcome. We can quantify the effect by calculating our η2 value which can be calculated as
\begin{equation}
\eta^2 = \frac{SS_a}{SS_a + SS_{error}}
\end{equation}
where SSa is the sum of squares of some parameter/effect/variable and if η2 is 0.14 or greater we can say that is a large effective, between 0.06 and 0.14 is a medium effect, and 0.01 or lower is a small effect. So we can see in our analysis below that fertilizer has a large effect on the crop yield.
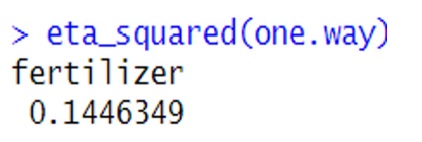
Figure \(\PageIndex{3}\): Size effect of fertilizer.
Two-Way ANOVA
We can also run Two-Way ANOVA analysis to calculate the total sum of squares we can use the following identity
\begin{equation}
\sum_{i=1}^a \sum_{j=1}^b (y_{ij}-\overline{y}_{..})^2 = \sum_{i=1}^a \sum_{j=1}^b (y_{ij}-\overline{y}_{i.}-\overline{y}_{.j}+\overline{y}_{..})^2+b\sum_{i=1}^a (\overline{y}_{i.}-\overline{y}_{..})^2+ a\sum_{j=1}^b (\overline{y}_{.j}-\overline{y}_{..})^2
\end{equation}
We can also define our new sum of squares as
\begin{equation}
SS = b\sum_{i=1}^a (\overline{y}_{i.}-\overline{y}_{..})^2
\end{equation}
The block sum of squares is defined as
\begin{equation}
BSS= a\sum_{j=1}^b (\overline{y}_{.j}-\overline{y}_{..})^2
\end{equation}
The error sum of squares is
\begin{equation}
ESS = \sum_{i=1}^a \sum_{j=1}^b (y_{ij}-\overline{y}_{i.}-\overline{y}_{.j}+\overline{y}_{..})^2
\end{equation}
and the total sum of squares is
\begin{equation}
TSS = \sum_{i=1}^a \sum_{j=1}^b (y_{ij}-\overline{y}_{..})^2
\end{equation}
The degrees of freedom calculation for a Two-Way ANOVA will be
\begin{equation}
df = ab-a = (a-1) + (b-1) + (a-1)(b-1)
\end{equation}
The F-ratio for the a variable will be
\begin{equation}
F_a = \frac{\frac{TSS}{(a-1)}}{\frac{ESS}{(a-1)(b-1)}}
\end{equation}
and for the b variable
\begin{equation}
F_b = \frac{\frac{BSS}{(b-1)}}{\frac{ESS}{(a-1)(b-1)}}
\end{equation}
We can now run our Two-Way ANOVA in R and Python and look at the ANOVA table result below.

Figure \(\PageIndex{4}\): R Two-Way ANOVA Result Table.
Here we can see some very interesting results. We again observe that fertilizer has a statistically significant effect on crop yield as does the density of crop planting. However, we see that the combined density and fertilizer variable does not have a statistically significant effect on the crop yield.
We can also confirm again that fertilizer has a large effect, density has a medium effect based on the η2 value. And the combined variable of density and fertilizer is a small effect.
We can also see our post-hoc Games Howell test and confirm our previous results for fertilizer but also we see that for density there is a statistically significant difference between density type 1 and 2.
We can even extend this to three variables as well..
Three-Way ANOVA
One can perform another extension of the previous equations and we can run a Three-Way ANOVA and see the results below
Here we can perform a similar analysis and we can see that there is no statistically significant effect block location can have on the yield of the crop and neither does the two way variable of fertilizer and block, however density and block has a statistically significant effect on crop yield as does fertilizer, density, and block variables as well.
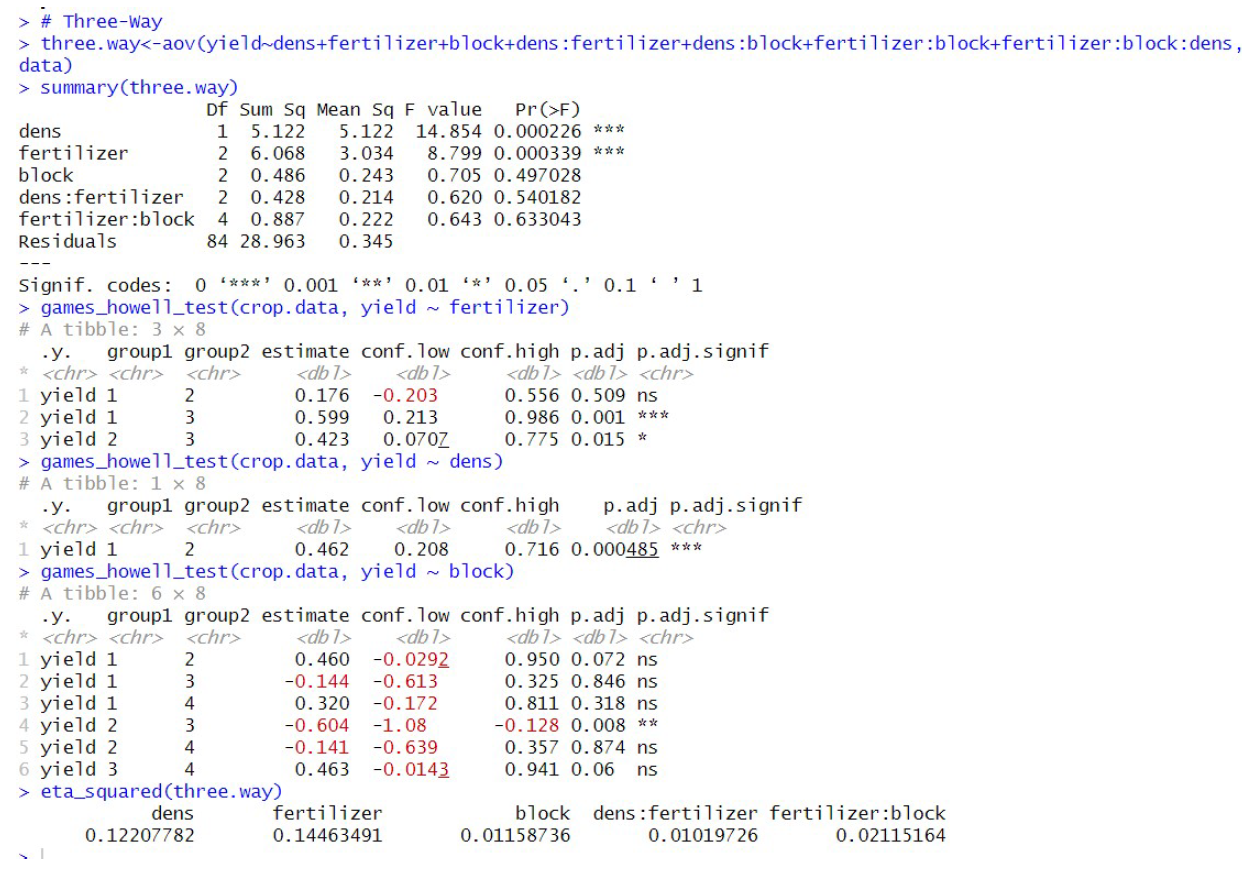
Figure \(\PageIndex{5}\): R Three-Way ANOVA Result Table.
We can also see that density has a medium effect, block has a small effet as does density and fertilizer and fertilizer and block variables.
Finally, we see that for the block variable there is only a statistically significant effect between block 2 and 3.
ANOVA is an incredibly useful tool!!