
11.6: Exercises
- Page ID
- 52966

\( \newcommand{\vecs}[1]{\overset { \scriptstyle \rightharpoonup} {\mathbf{#1}} } \)
\( \newcommand{\vecd}[1]{\overset{-\!-\!\rightharpoonup}{\vphantom{a}\smash {#1}}} \)
\( \newcommand{\dsum}{\displaystyle\sum\limits} \)
\( \newcommand{\dint}{\displaystyle\int\limits} \)
\( \newcommand{\dlim}{\displaystyle\lim\limits} \)
\( \newcommand{\id}{\mathrm{id}}\) \( \newcommand{\Span}{\mathrm{span}}\)
( \newcommand{\kernel}{\mathrm{null}\,}\) \( \newcommand{\range}{\mathrm{range}\,}\)
\( \newcommand{\RealPart}{\mathrm{Re}}\) \( \newcommand{\ImaginaryPart}{\mathrm{Im}}\)
\( \newcommand{\Argument}{\mathrm{Arg}}\) \( \newcommand{\norm}[1]{\| #1 \|}\)
\( \newcommand{\inner}[2]{\langle #1, #2 \rangle}\)
\( \newcommand{\Span}{\mathrm{span}}\)
\( \newcommand{\id}{\mathrm{id}}\)
\( \newcommand{\Span}{\mathrm{span}}\)
\( \newcommand{\kernel}{\mathrm{null}\,}\)
\( \newcommand{\range}{\mathrm{range}\,}\)
\( \newcommand{\RealPart}{\mathrm{Re}}\)
\( \newcommand{\ImaginaryPart}{\mathrm{Im}}\)
\( \newcommand{\Argument}{\mathrm{Arg}}\)
\( \newcommand{\norm}[1]{\| #1 \|}\)
\( \newcommand{\inner}[2]{\langle #1, #2 \rangle}\)
\( \newcommand{\Span}{\mathrm{span}}\) \( \newcommand{\AA}{\unicode[.8,0]{x212B}}\)
\( \newcommand{\vectorA}[1]{\vec{#1}} % arrow\)
\( \newcommand{\vectorAt}[1]{\vec{\text{#1}}} % arrow\)
\( \newcommand{\vectorB}[1]{\overset { \scriptstyle \rightharpoonup} {\mathbf{#1}} } \)
\( \newcommand{\vectorC}[1]{\textbf{#1}} \)
\( \newcommand{\vectorD}[1]{\overrightarrow{#1}} \)
\( \newcommand{\vectorDt}[1]{\overrightarrow{\text{#1}}} \)
\( \newcommand{\vectE}[1]{\overset{-\!-\!\rightharpoonup}{\vphantom{a}\smash{\mathbf {#1}}}} \)
\( \newcommand{\vecs}[1]{\overset { \scriptstyle \rightharpoonup} {\mathbf{#1}} } \)
\(\newcommand{\longvect}{\overrightarrow}\)
\( \newcommand{\vecd}[1]{\overset{-\!-\!\rightharpoonup}{\vphantom{a}\smash {#1}}} \)
\(\newcommand{\avec}{\mathbf a}\) \(\newcommand{\bvec}{\mathbf b}\) \(\newcommand{\cvec}{\mathbf c}\) \(\newcommand{\dvec}{\mathbf d}\) \(\newcommand{\dtil}{\widetilde{\mathbf d}}\) \(\newcommand{\evec}{\mathbf e}\) \(\newcommand{\fvec}{\mathbf f}\) \(\newcommand{\nvec}{\mathbf n}\) \(\newcommand{\pvec}{\mathbf p}\) \(\newcommand{\qvec}{\mathbf q}\) \(\newcommand{\svec}{\mathbf s}\) \(\newcommand{\tvec}{\mathbf t}\) \(\newcommand{\uvec}{\mathbf u}\) \(\newcommand{\vvec}{\mathbf v}\) \(\newcommand{\wvec}{\mathbf w}\) \(\newcommand{\xvec}{\mathbf x}\) \(\newcommand{\yvec}{\mathbf y}\) \(\newcommand{\zvec}{\mathbf z}\) \(\newcommand{\rvec}{\mathbf r}\) \(\newcommand{\mvec}{\mathbf m}\) \(\newcommand{\zerovec}{\mathbf 0}\) \(\newcommand{\onevec}{\mathbf 1}\) \(\newcommand{\real}{\mathbb R}\) \(\newcommand{\twovec}[2]{\left[\begin{array}{r}#1 \\ #2 \end{array}\right]}\) \(\newcommand{\ctwovec}[2]{\left[\begin{array}{c}#1 \\ #2 \end{array}\right]}\) \(\newcommand{\threevec}[3]{\left[\begin{array}{r}#1 \\ #2 \\ #3 \end{array}\right]}\) \(\newcommand{\cthreevec}[3]{\left[\begin{array}{c}#1 \\ #2 \\ #3 \end{array}\right]}\) \(\newcommand{\fourvec}[4]{\left[\begin{array}{r}#1 \\ #2 \\ #3 \\ #4 \end{array}\right]}\) \(\newcommand{\cfourvec}[4]{\left[\begin{array}{c}#1 \\ #2 \\ #3 \\ #4 \end{array}\right]}\) \(\newcommand{\fivevec}[5]{\left[\begin{array}{r}#1 \\ #2 \\ #3 \\ #4 \\ #5 \\ \end{array}\right]}\) \(\newcommand{\cfivevec}[5]{\left[\begin{array}{c}#1 \\ #2 \\ #3 \\ #4 \\ #5 \\ \end{array}\right]}\) \(\newcommand{\mattwo}[4]{\left[\begin{array}{rr}#1 \amp #2 \\ #3 \amp #4 \\ \end{array}\right]}\) \(\newcommand{\laspan}[1]{\text{Span}\{#1\}}\) \(\newcommand{\bcal}{\cal B}\) \(\newcommand{\ccal}{\cal C}\) \(\newcommand{\scal}{\cal S}\) \(\newcommand{\wcal}{\cal W}\) \(\newcommand{\ecal}{\cal E}\) \(\newcommand{\coords}[2]{\left\{#1\right\}_{#2}}\) \(\newcommand{\gray}[1]{\color{gray}{#1}}\) \(\newcommand{\lgray}[1]{\color{lightgray}{#1}}\) \(\newcommand{\rank}{\operatorname{rank}}\) \(\newcommand{\row}{\text{Row}}\) \(\newcommand{\col}{\text{Col}}\) \(\renewcommand{\row}{\text{Row}}\) \(\newcommand{\nul}{\text{Nul}}\) \(\newcommand{\var}{\text{Var}}\) \(\newcommand{\corr}{\text{corr}}\) \(\newcommand{\len}[1]{\left|#1\right|}\) \(\newcommand{\bbar}{\overline{\bvec}}\) \(\newcommand{\bhat}{\widehat{\bvec}}\) \(\newcommand{\bperp}{\bvec^\perp}\) \(\newcommand{\xhat}{\widehat{\xvec}}\) \(\newcommand{\vhat}{\widehat{\vvec}}\) \(\newcommand{\uhat}{\widehat{\uvec}}\) \(\newcommand{\what}{\widehat{\wvec}}\) \(\newcommand{\Sighat}{\widehat{\Sigma}}\) \(\newcommand{\lt}{<}\) \(\newcommand{\gt}{>}\) \(\newcommand{\amp}{&}\) \(\definecolor{fillinmathshade}{gray}{0.9}\)Analysis
1. Determine the effective impedance of the network shown in Figure \(\PageIndex{1}\) at 10 MHz.
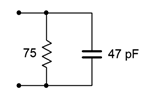
Figure \(\PageIndex{1}\)
2. Determine the effective impedance of the network shown in Figure \(\PageIndex{2}\) at 100 Hz.
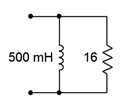
Figure \(\PageIndex{2}\)
3. Determine the effective impedance of the network shown in Figure \(\PageIndex{3}\) at 5 kHz.
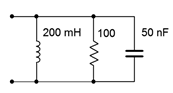
Figure \(\PageIndex{3}\)
4. Determine the effective impedance of the network shown in Figure \(\PageIndex{4}\) at 20 kHz.
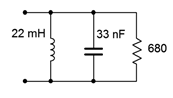
Figure \(\PageIndex{4}\)
5. Determine the effective impedance of the network shown in Figure \(\PageIndex{5}\).
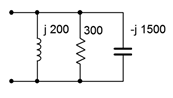
Figure \(\PageIndex{5}\)
6. Determine the effective impedance of the network shown in Figure \(\PageIndex{5}\) if the frequency is halved and if the frequency is doubled.
7. For the network shown in Figure \(\PageIndex{1}\), determine the frequency below which the impedance is mostly resistive.
8. For the network shown in Figure \(\PageIndex{2}\), determine the frequency below which the impedance is mostly inductive.
9. Draw phasor impedance plot for problem 1.
10. Draw phasor impedance plot for problem 2.
11. Determine the three branch currents for the circuit shown in Figure \(\PageIndex{6}\) and draw their phasor diagram.
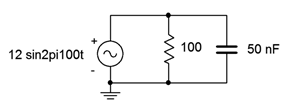
Figure \(\PageIndex{6}\)
12. Determine the three branch currents for the circuit shown in Figure \(\PageIndex{7}\) and draw their phasor diagram.
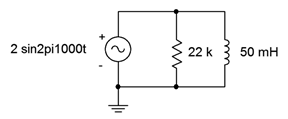
Figure \(\PageIndex{7}\)
13. Determine the four branch currents for the circuit shown in Figure \(\PageIndex{8}\) and draw their phasor diagram.
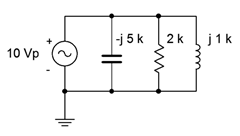
Figure \(\PageIndex{8}\)
14. Determine all of the branch currents for the circuit shown in Figure \(\PageIndex{9}\) assuming \(E\) is a 1 volt RMS sine.
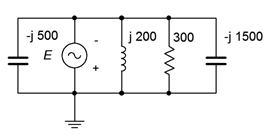
Figure \(\PageIndex{9}\)
15. Determine all of the branch currents for the circuit shown in Figure \(\PageIndex{10}\) given \(E\) = 10 volt peak sine, \(R\) = 220, \(X_C = −j500\). and \(X_L = j1.5\) k.
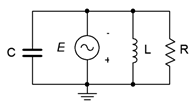
Figure \(\PageIndex{10}\)
16. Determine all of the branch currents for the circuit shown in Figure \(\PageIndex{11}\) given \(E\) = 2 volt peak sine, \(R\) = 1 k, \(X_C = −j2\) k. and \(X_L = j3\) k.
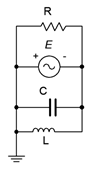
Figure \(\PageIndex{11}\)
17. Determine the component currents for the circuit shown in Figure \(\PageIndex{12}\). Draw phasor diagram of the source and branch currents.
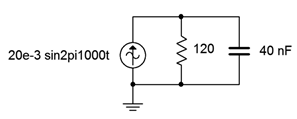
Figure \(\PageIndex{12}\)
18. Determine the resistor and capacitor voltages for the circuit shown in Figure \(\PageIndex{12}\).
19. Determine the resistor and inductor voltages for the circuit shown in Figure \(\PageIndex{13}\).
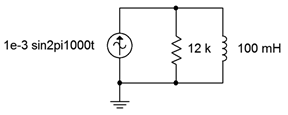
Figure \(\PageIndex{13}\)
20. Determine the component currents for the circuit shown in Figure \(\PageIndex{13}\). Draw phasor diagram of the source and branch currents.
21. Determine the source voltage for the circuit shown in Figure \(\PageIndex{14}\).
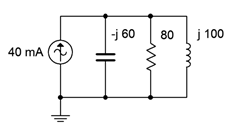
Figure \(\PageIndex{14}\)
22. Determine the component currents for the circuit shown in Figure \(\PageIndex{14}\). Draw the phasor diagram of the source and branch currents.
23. Determine the component currents for the circuit shown in Figure \(\PageIndex{15}\). \(I\) is 20 mA at 0 degrees.
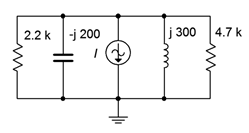
Figure \(\PageIndex{15}\)
24. Determine the source voltage for the circuit shown in Figure \(\PageIndex{15}\). \(I\) is 20 mA at 0 degrees.
25. Determine the source voltage for the circuit shown in Figure \(\PageIndex{16}\). Assume \(I1\) is 1 mA at 0 degrees and \(I2\) is 2 mA at +90 degrees.
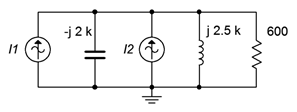
Figure \(\PageIndex{16}\)
26. Determine the capacitor and inductor currents in the circuit of Figure \(\PageIndex{16}\). Assume \(I1\) is 1 mA at 0 degrees and \(I2\) is 2 mA at +90 degrees.
27. Determine the resistor and capacitor currents in the circuit of Figure \(\PageIndex{17}\). Assume \(I1\) is \(2\angle 0^{\circ}\) amps and \(I2\) is \(0.5\angle 45^{\circ}\).
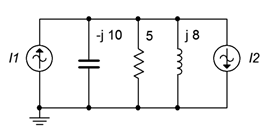
Figure \(\PageIndex{17}\)
28. Determine the source voltage for the circuit shown in Figure \(\PageIndex{17}\). Assume \(I1\) is \(2\angle 0^{\circ}\) A and \(I2\) is \(0.5\angle 45^{\circ}\).
Design
29. For the network shown in Figure \(\PageIndex{18}\), determine a value of \(C\) such that the impedance magnitude of the circuit is 1 k\(\Omega\). The source is a 50 Hz sine and \(R\) is 2.2 k\(\Omega\).
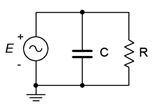
Figure \(\PageIndex{18}\)
30. For the network shown in Figure \(\PageIndex{19}\), determine a value of \(L\) such that the impedance magnitude of the circuit is 2 k\(\Omega\). The source is a 2 MHz sine and \(R\) is 3.3 k\(\Omega\).
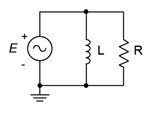
Figure \(\PageIndex{19}\)
31. For the circuit shown in Figure \(\PageIndex{18}\), determine a value for \(C\) such that the magnitude of the source current is 1 mA. \(E\) is a 2 volt 10 kHz sine and \(R\) = 8 k\(\Omega\).
32. For the network shown in Figure \(\PageIndex{19}\), determine a value for \(L\) such that the magnitude of the source current is 10 mA. \(E\) is a 25 volt 100 kHz sine and \(R\) = 4 k\(\Omega\).
33. For the network shown in Figure \(\PageIndex{20}\), determine a value of \(C\) such that the impedance magnitude of the circuit is 10 k \(\Omega\). The source is a 440 Hz sine and \(R\) is 33 k\(\Omega\).
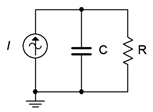
Figure \(\PageIndex{20}\)
34. For the network shown in Figure \(\PageIndex{21}\), determine a value of \(L\) such that the impedance magnitude of the circuit is 200 \(\Omega\). The source is a 60 Hz sine and \(R\) is 680 \(\Omega\).
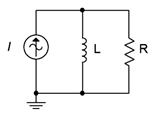
Figure \(\PageIndex{21}\)
35. For the circuit shown in Figure \(\PageIndex{20}\), determine a value for \(C\) such that the magnitude of the circuit voltage is 200 volts. The source current is a 100 mA 1200 Hz sine and \(R\) = 15 k\(\Omega\).
36. For the circuit shown in Figure \(\PageIndex{21}\), determine a value for \(L\) such that the magnitude of the circuit voltage is 50 volts. The source current is a 2.3 A 60 Hz sine and \(R\) = 330 \(\Omega\).
37. Given the circuit shown in Figure \(\PageIndex{18}\), determine a value for \(C\) such that the impedance angle is −45 degrees. The source a 1 volt peak sine at 600 Hz and \(R\) = 680 \(\Omega\).
38. Given the circuit shown in Figure \(\PageIndex{19}\), determine a value for \(L\) such that the impedance angle is 45 degrees. The source a 10 volt peak sine at 100 kHz and \(R\) = 1.2 k\(\Omega\).
39. Determine a value for \(C\) such \(|X_C| = |X_L|\) for the circuit shown in Figure \(\PageIndex{22}\). The source frequency is 1 kHz, \(R\) = 200 \(\Omega\) and \(L\) = 50 mH.
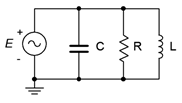
Figure \(\PageIndex{22}\)
40. Determine a value for \(L\) such \(|X_C| = |X_L|\) for the circuit shown in Figure \(\PageIndex{23}\). The source frequency is 22 kHz, \(R\) = 18 k\(\Omega\) and \(C\) = 5 nF.
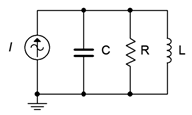
Figure \(\PageIndex{23}\)
41. Add one or more components in parallel with the circuit of Figure \(\PageIndex{2}\) such that the resulting impedance at 20 Hz is 10 \(\Omega\) with a phase angle of at least +\(30^{\circ}\).
Challenge
42. Determine a value for \(C\) such that the impedance angle for the circuit shown in Figure \(\PageIndex{22}\) is purely resistive (0 degrees). The source frequency is 1 kHz, \(R\) = 200 \(\Omega\) and \(L\) = 50 mH.
43. Is it possible to change the value of the resistor in Figure \(\PageIndex{14}\) so that the system voltage is 4 volts? If so, what is the value? If not, why not?
44. Is it possible to change the value of the inductor and/or capacitor in Figure \(\PageIndex{14}\) so that the system voltage is 4 volts? If so, what is/are the values? If not, why not?
45. Assume you are troubleshooting a circuit like the one shown in Figure \(\PageIndex{23}\). \(I\) is a 10 mA peak sine at 2 kHz, \(R\) = 390 \(\Omega\), \(C\) = 200 nF and \(L\) = 25 mH. The measured resistor voltage is a little under 2.5 volts. What is the likely culprit?
46. Given the circuit shown in Figure \(\PageIndex{23}\), find the values for \(C\) and \(L\) if the source is a sine wave at 1 kHz, \(R\) = 4 k\(\Omega\), \(i_{Source}\) = 3 mA, \(i_R\) = 2 mA, \(i_L\) = 5 mA,
Simulation
47. Using a transient analysis simulation, verify that the source current magnitude is 1 mA using the capacitor value determined in design problem 31.
48. Using a transient analysis simulation, verify that the source current magnitude is 10 mA using the inductor value determined in design problem 32.
49. Using a transient analysis simulation, verify that the source voltage magnitude is 200 volts using the capacitor value determined in design problem 35.
50. Using a transient analysis simulation, verify that the source voltage magnitude is 50 volts using the inductor value determined in design problem 36.
51. Using a transient analysis simulation, verify the design solution for problem 39. This can be checked by seeing if the current magnitudes in \(C\) and \(L\) are identical.
52. Using a transient analysis simulation, verify the design solution for problem 40. This can be checked by seeing if the current magnitudes in \(C\) and \(L\) are identical.
53. Impedance magnitude as a function of frequency can be investigated by driving the circuit with a fixed amplitude current source across a range of frequencies. The resulting voltage will be proportional to the effective impedance. Investigate this effect by performing an AC analysis on the circuits shown in Figures \(\PageIndex{12}\) and \(\PageIndex{13}\). Use a frequency range of 10 Hz to 1 MHz. Before running the simulations, sketch your expected results.
54. Following the idea presented in the previous problem, investigate the impedance as a function of frequency of the circuit shown in Figure \(\PageIndex{23}\). Use \(R\) = 1 k, \(C\) = 10 nF, and \(L\) = 1 mH. Run the simulation from 100 Hz to 10 MHz. Make sure to sketch your expected results first.