
13.1: Introduction and Background
- Page ID
- 93731
\( \newcommand{\vecs}[1]{\overset { \scriptstyle \rightharpoonup} {\mathbf{#1}} } \)
\( \newcommand{\vecd}[1]{\overset{-\!-\!\rightharpoonup}{\vphantom{a}\smash {#1}}} \)
\( \newcommand{\dsum}{\displaystyle\sum\limits} \)
\( \newcommand{\dint}{\displaystyle\int\limits} \)
\( \newcommand{\dlim}{\displaystyle\lim\limits} \)
\( \newcommand{\id}{\mathrm{id}}\) \( \newcommand{\Span}{\mathrm{span}}\)
( \newcommand{\kernel}{\mathrm{null}\,}\) \( \newcommand{\range}{\mathrm{range}\,}\)
\( \newcommand{\RealPart}{\mathrm{Re}}\) \( \newcommand{\ImaginaryPart}{\mathrm{Im}}\)
\( \newcommand{\Argument}{\mathrm{Arg}}\) \( \newcommand{\norm}[1]{\| #1 \|}\)
\( \newcommand{\inner}[2]{\langle #1, #2 \rangle}\)
\( \newcommand{\Span}{\mathrm{span}}\)
\( \newcommand{\id}{\mathrm{id}}\)
\( \newcommand{\Span}{\mathrm{span}}\)
\( \newcommand{\kernel}{\mathrm{null}\,}\)
\( \newcommand{\range}{\mathrm{range}\,}\)
\( \newcommand{\RealPart}{\mathrm{Re}}\)
\( \newcommand{\ImaginaryPart}{\mathrm{Im}}\)
\( \newcommand{\Argument}{\mathrm{Arg}}\)
\( \newcommand{\norm}[1]{\| #1 \|}\)
\( \newcommand{\inner}[2]{\langle #1, #2 \rangle}\)
\( \newcommand{\Span}{\mathrm{span}}\) \( \newcommand{\AA}{\unicode[.8,0]{x212B}}\)
\( \newcommand{\vectorA}[1]{\vec{#1}} % arrow\)
\( \newcommand{\vectorAt}[1]{\vec{\text{#1}}} % arrow\)
\( \newcommand{\vectorB}[1]{\overset { \scriptstyle \rightharpoonup} {\mathbf{#1}} } \)
\( \newcommand{\vectorC}[1]{\textbf{#1}} \)
\( \newcommand{\vectorD}[1]{\overrightarrow{#1}} \)
\( \newcommand{\vectorDt}[1]{\overrightarrow{\text{#1}}} \)
\( \newcommand{\vectE}[1]{\overset{-\!-\!\rightharpoonup}{\vphantom{a}\smash{\mathbf {#1}}}} \)
\( \newcommand{\vecs}[1]{\overset { \scriptstyle \rightharpoonup} {\mathbf{#1}} } \)
\(\newcommand{\longvect}{\overrightarrow}\)
\( \newcommand{\vecd}[1]{\overset{-\!-\!\rightharpoonup}{\vphantom{a}\smash {#1}}} \)
\(\newcommand{\avec}{\mathbf a}\) \(\newcommand{\bvec}{\mathbf b}\) \(\newcommand{\cvec}{\mathbf c}\) \(\newcommand{\dvec}{\mathbf d}\) \(\newcommand{\dtil}{\widetilde{\mathbf d}}\) \(\newcommand{\evec}{\mathbf e}\) \(\newcommand{\fvec}{\mathbf f}\) \(\newcommand{\nvec}{\mathbf n}\) \(\newcommand{\pvec}{\mathbf p}\) \(\newcommand{\qvec}{\mathbf q}\) \(\newcommand{\svec}{\mathbf s}\) \(\newcommand{\tvec}{\mathbf t}\) \(\newcommand{\uvec}{\mathbf u}\) \(\newcommand{\vvec}{\mathbf v}\) \(\newcommand{\wvec}{\mathbf w}\) \(\newcommand{\xvec}{\mathbf x}\) \(\newcommand{\yvec}{\mathbf y}\) \(\newcommand{\zvec}{\mathbf z}\) \(\newcommand{\rvec}{\mathbf r}\) \(\newcommand{\mvec}{\mathbf m}\) \(\newcommand{\zerovec}{\mathbf 0}\) \(\newcommand{\onevec}{\mathbf 1}\) \(\newcommand{\real}{\mathbb R}\) \(\newcommand{\twovec}[2]{\left[\begin{array}{r}#1 \\ #2 \end{array}\right]}\) \(\newcommand{\ctwovec}[2]{\left[\begin{array}{c}#1 \\ #2 \end{array}\right]}\) \(\newcommand{\threevec}[3]{\left[\begin{array}{r}#1 \\ #2 \\ #3 \end{array}\right]}\) \(\newcommand{\cthreevec}[3]{\left[\begin{array}{c}#1 \\ #2 \\ #3 \end{array}\right]}\) \(\newcommand{\fourvec}[4]{\left[\begin{array}{r}#1 \\ #2 \\ #3 \\ #4 \end{array}\right]}\) \(\newcommand{\cfourvec}[4]{\left[\begin{array}{c}#1 \\ #2 \\ #3 \\ #4 \end{array}\right]}\) \(\newcommand{\fivevec}[5]{\left[\begin{array}{r}#1 \\ #2 \\ #3 \\ #4 \\ #5 \\ \end{array}\right]}\) \(\newcommand{\cfivevec}[5]{\left[\begin{array}{c}#1 \\ #2 \\ #3 \\ #4 \\ #5 \\ \end{array}\right]}\) \(\newcommand{\mattwo}[4]{\left[\begin{array}{rr}#1 \amp #2 \\ #3 \amp #4 \\ \end{array}\right]}\) \(\newcommand{\laspan}[1]{\text{Span}\{#1\}}\) \(\newcommand{\bcal}{\cal B}\) \(\newcommand{\ccal}{\cal C}\) \(\newcommand{\scal}{\cal S}\) \(\newcommand{\wcal}{\cal W}\) \(\newcommand{\ecal}{\cal E}\) \(\newcommand{\coords}[2]{\left\{#1\right\}_{#2}}\) \(\newcommand{\gray}[1]{\color{gray}{#1}}\) \(\newcommand{\lgray}[1]{\color{lightgray}{#1}}\) \(\newcommand{\rank}{\operatorname{rank}}\) \(\newcommand{\row}{\text{Row}}\) \(\newcommand{\col}{\text{Col}}\) \(\renewcommand{\row}{\text{Row}}\) \(\newcommand{\nul}{\text{Nul}}\) \(\newcommand{\var}{\text{Var}}\) \(\newcommand{\corr}{\text{corr}}\) \(\newcommand{\len}[1]{\left|#1\right|}\) \(\newcommand{\bbar}{\overline{\bvec}}\) \(\newcommand{\bhat}{\widehat{\bvec}}\) \(\newcommand{\bperp}{\bvec^\perp}\) \(\newcommand{\xhat}{\widehat{\xvec}}\) \(\newcommand{\vhat}{\widehat{\vvec}}\) \(\newcommand{\uhat}{\widehat{\uvec}}\) \(\newcommand{\what}{\widehat{\wvec}}\) \(\newcommand{\Sighat}{\widehat{\Sigma}}\) \(\newcommand{\lt}{<}\) \(\newcommand{\gt}{>}\) \(\newcommand{\amp}{&}\) \(\definecolor{fillinmathshade}{gray}{0.9}\)A data warehouse an element of computing systems considered a core part of many businesses. They are mainly used for data analysis. A data warehouse combines information from multiple different places electronically into one single all-inclusive database. For example, companies may combine sales from the cash registers in a store, online sales, and company-to-company orders all together as one database. Data warehouses are made for this purpose.
A data warehouse is a collection of data that is non-updateable, time-variant, integrated, and subject-oriented that is used in the support of decision-making management processes and business intelligence. The meaning of each of these terms is important for defining what a data warehouse is. The term non-updateable means the information in the data warehouse can be refreshed and loaded from operational systems, but cannot be updated by end users. The term time-variant means the information in the data warehouse contains a dimension of time so that they can be used to study changes and trends. The term integrated refers to the data in the data warehouse are characterized using consistent formats, encoding structures, related characteristics, and naming conventions gathered from many internal or external systems of record. The term subject-oriented means the data warehouse is organized around key subjects, or higher-level entities, of the enterprise. These major subjects may include students, patients, products, or time. The data warehouse is not a mere consolidation of all of the operational databases of an organization. Because of a data warehouse’s focus on business intelligence, time-variant data, and external data, a data warehouse is distinct from a simple database. Data warehousing is a process where organizations build and maintain data assets. Making successful a data warehouse requires proven practices of data warehousing, strong organizational commitment, sound project management, and making the right technology decisions.
Putting all this information into one place makes it a lot easier for people to look at and evaluate that information. It also makes the jobs of data miners and data analysts much easier, since they can find everything all in one place. It can even help companies realize higher profits and make sales a lot easier.
Data warehouses have many other advantages that come from combining data from several locations into one central database. Data warehouses prevent database isolation sometimes caused by running very long queries. Even if source transaction systems fail, the data warehouse will still maintain data history. They also much more consistently provide data to the end user, helping to prevent mistakes. A data warehouse can also reorganize all of the information found to make it much easier to read for analysts and to help them more clearly understand the content. Reorganizing the information properly can also increase the performance for queries very noticeably. It can even make the queries much easier to construct in many instances.
Although there are many positives to data warehouses, they have their cons. They can often make certain employers have to do even more work. This would include gathering data from other workers and customers to help maintain the warehouse. Another common issue with data warehousing is the cost-to-benefit ratio. This is a huge project for businesses, and it could take up thousands of hours to establish. Sometimes it just isn’t used enough to make up for the enormous implementation costs. This is before even mentioning the huge amount of money it takes to maintain the data warehouse and keep it up and going. You also have to update it and do a lot of maintenance for it as your business grows which can be a pain at certain times. The price for a simple one-terabyte data warehouse with around one hundred thousand queries per month can cost as much as four hundred and sixty-eight thousand dollars a year. For big companies, this might not be a huge deal, but this is definitely not affordable for smaller businesses. Businesses must carefully consider whether they truly need a data warehouse.
The privacy and security of your data for a data warehouse is also only as good as your cloud services, so for smaller businesses, data may not be safe. If a corporation’s warehouse is accessed and leaks customer information, it could be terrible for the company. It would give out possibly customers’ credit card information and damage the company’s reputation. Although there are many things that can go wrong with a data warehouse, if you know how to use one correctly the positives outweigh the negatives.
There are many ways to create a data warehouse and several different ways to upload all the information quickly. First, consider all of the data from each individual source: for example, all data from the cash registers, online sales, and company sales. Next, remove all of the redundant data, so there is no repetition to corrupt the information provided. Lastly, reorganize all of the data obtained into a consistent format so that it can all be queried. A query is a request for information from a specific table inside of a database.
There are three main types of data warehouses. First is the Enterprise Data Warehouse, which is a central database. It has decision support services. Its approach is unified for keeping the data in the warehouse organized, which helps present the data easier. Users can also sort the data more easily according to category.
Next, we have the Operational Data Store. The Operational Data Store (ODS) is nothing but data being stored for when there is no organization needed. ODS is refreshed in real time. It is highly recommended to use ODS over the other two methods for more simple things like storing employees’ hours or pay to keep things simpler.
The last form of data warehouse is a Data Mart. Data Marts are basically just a subset of the actual data from the data warehouse. It was made precisely for sales and financing businesses. If the data mart is self-regulating, then data can be composed straight from the founding source. Basically, any data warehouse that is mostly used for money-related purposes should be created as a data mart.
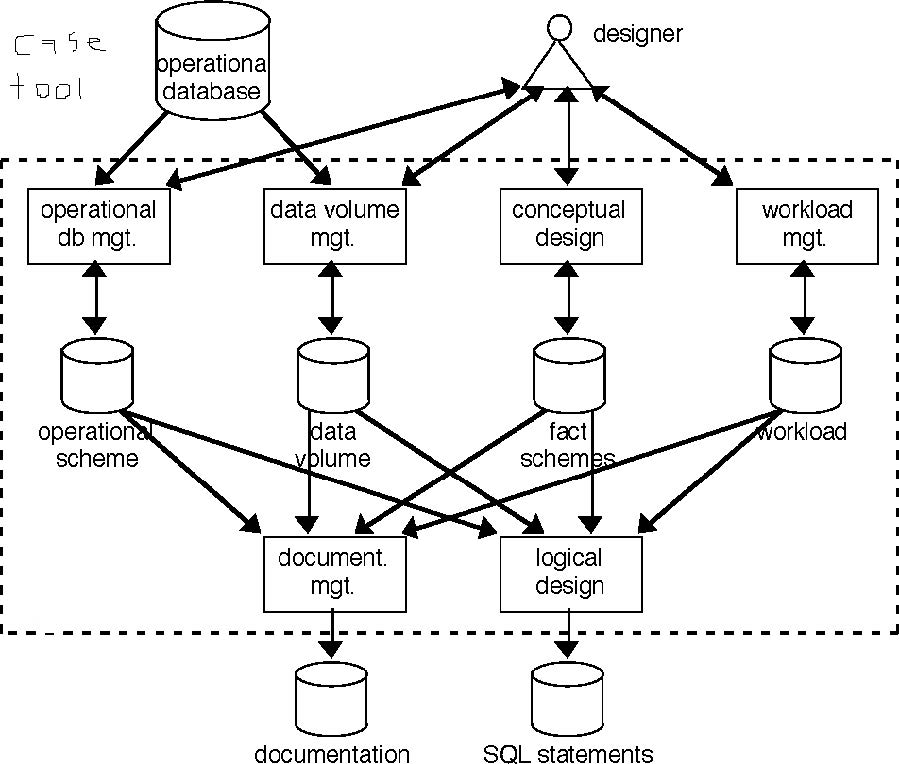
There are multiple different components of a data warehouse. First, the Load Manager is also known as the “front component” of the warehouse. It is called the front component because it works with the main extraction of data to load it all into the data warehouse. Next we have the Warehouse Manager, which is used to manage the data inside of the warehouse. It helps to investigate the data inside the warehouse to make sure it stays consistent throughout. The Query Manager is another key component to the warehouse, its main job being to manage the queries for the warehouse. Since it manages the queries of the warehouse it is also known by some as the “backend component.” Lastly, we have the end-user access tools, which are assembled into five different categories. The first category is responsible for reporting the warehouse data to management. The second category is used to store the tools for the queries. The third category is for tools that help application development. The fourth category is for EIS tools. Lastly, the fifth category is for OLAP and data mining tools.
Next, we discuss the architecture of a data warehouse. A simple data warehouse design is where all the different forms of data are stored in the central repository of the date warehouse. The repository receives information from each source and then is used for data analysis and mining. Next we have simple architecture design with a staging area included. All of the non-required data must be prepared before going to the warehouse, because only the necessary data is wanted. The staging part of the warehouse prepares data before it actually goes into the data warehouse. The next form is called hub-and-spoke warehousing. It works similarly to a staging area, but instead adds a data mart after the central repository to further customize the data warehouse, which may be needed in certain types of business applications. After the data is sorted, cleaned, and ready to use, it is moved into the responding data mart. Lastly, sandboxes are very private and protected data stores, which make them very efficient and allow new ways of analyzing the data sets without having to follow the basic rules of the data warehouse.
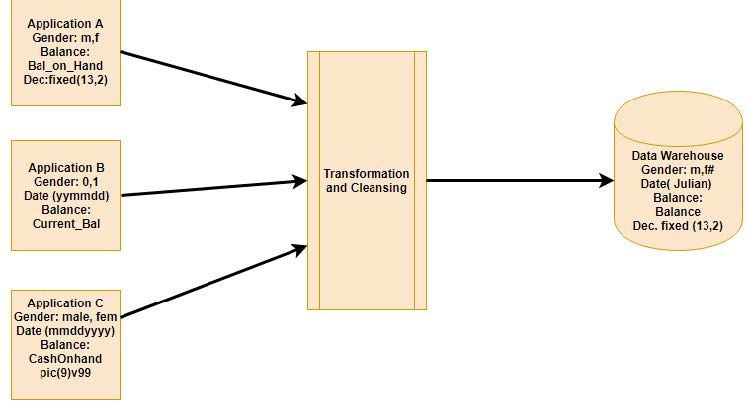
Many tools and utilities are required to effectively use a data warehouse. These can be very useful when navigating the warehouse. Data Extraction is used to get data from several different outside sources and present them. Data Cleaning tools can also be very useful for finding the errors inside of the data set, even correcting them for the user. This can also be used to get rid of duplicate data. Data Transformation tools are used for converting the format type of the data sets. For example, if the date is in a legacy format, it can easily be transformed to warehouse standards. Data Loading is used mostly for sorting and checking reliability of data. The refresh tool is just for simply updating the sources into the warehouse format.
There are three main ways to test a data warehouse. The first method is called Unit Testing and consists of testing each individual part of the warehouse in turn. This test is usually done by the developer. Next is Integration Testing, in which different parts of the application are formed into one, then tested compared to the number of inputs put in. This method is mainly used to make sure all of the parts work together after combining them. Lastly, System Testing tests all the data in the entire data warehouse together. This the final check to make sure that everything is working together as a final product. This kind of testing is the testing done by the whole team.
Most organizations have a plethora of data but cannot access it effectively and efficiently. There are multiple reasons why there is a knowledge gap between so many organizations. The first reason is because organizations have a fragmented way in which they created their information systems and databases. Because these organizations have time constraints and resource constraints, they have been developing information systems one at a time. This creates inconsistent and uncoordinated databases. Databases are usually based on different purchased applications, software platforms, and hardware that may have been brought in from a variety of organizational acquisitions, mergers, and reorganizations. From these circumstances, it can be very difficult or nearly impossible for managers to find and use accurate information that has to be synthesized across different systems.
Most systems are created to help operational processing, in which there is little to no thought is given to information and analytical tools needed to make decisions. Operation processing, also known as transactional processing, takes, stores, and changes data to help daily operations of an organization. It usually focuses on optimizing access to a small set of data that relates to a specific transaction—for example, a customer, an order, and associated product data. Information processing is an analysis of data or other forms of data to help decision making. Large swaths of data are needed to derive information, such as sales of total products, across several years, from all sales regions. Systems that are mostly developed internally or bought from outside vendors were designed to help operational processing, and very little thought is given to information processing.
The next trend is that multiple systems are not synchronized. It may be difficult, maybe impossible, to make separate databases consistent. Even if the metadata are controlled and created by only one data administrator, the values of data for the same attributes may not agree. That is because of a difference in update cycles and of the separate places where the same data is captured for all systems. Therefore, to get a single view of the organization, the data from separate systems has to be periodically separated and synchronized into one additional database.
Many organizations use some form of a balanced scorecard-metrics, which show organization results in customer satisfaction, product quality, human, financial, and other terms simultaneously. To make sure that this multidimensional view of the organization shows consistent results, a warehouse of data is necessary. When questions rise on the balanced scorecard, analytical software that the data warehouse may be used to “slice and dice,” “drill down,” visualize, and in many other ways mine business intelligence. The next trend is customer
relationship management. This is when organizations in all sections are realizing there is value in having a total picture of interactions with customers across all of the touch points. For example, for a bank, the touch points are ATMs, online banking, electronic fund transfers, tellers, loans, and investment portfolio management, all supported by consolidated operational systems. Therefore, without having a data warehouse, a teller does not know to try to cross-sell a customer one of the bank’s mutual funds if the large, atypical automatic deposit transaction shows up on the teller’s screen. To have a total picture of the activity by a given customer requires a consolidation of data from many different operational systems.
Another trend is supplier relationship management. The process of managing the supply chain has become critical in raising product quality and reducing costs for many organizations. Organizations desire to make strategic supplier partnerships that are based on a total picture of activities and suppliers, from billing, to the meeting of delivery dates, to support, to pricing, to quality control. Data about these different activities may be locked inside separate operational systems: for example, accounts payable, shipping and receiving, maintenance, and product scheduling. ERP systems also have improved this situation by bringing much of this data into a single database. However, many ERP systems tend to be designed to optimize operational, instead of informational or analytical, processing.
There is a need to separate informational and operational systems. An operational system must be a system which is used to run a business in actual time, based on current data. Some examples of operational systems are sales order, patient registration systems, and reservation systems. Operational systems have to process large volumes of relatively simple write/read transactions and provide fast responses. Operational systems can also be called systems of record. Informational systems were designed to support decision making based on historical prediction and point-in-time data. Also, they were designed for data-mining applications or complex queries. Some examples of informational systems would be customer segmentation, systems for sales trend analysis, and human resources planning.
The main differences between informational and operational systems are defined by six key characteristics. These characteristics are primary purpose, type of data, primary users, scope of usage, design goal, and volume. For the first characteristic, the primary purpose of an operational system is to run the business on current basis, but for informational systems, the primary purpose is to support managerial decision making. The second characteristic is type of data. The type of data that operational systems use is a current representation of the state of the business. The type of data that informational systems use is historical point-in-time, snapshots, and predictions. The third key characteristic is the primary user. The primary users of operational systems are administrators, clerks, and salespersons. The primary users of informational systems are managers, customers, and business analysts. The fourth key characteristic of the differences is the scope of usage. The scope of usage for operational systems is planned, narrow, and simple updates and queries. The scope of usage for informational systems is ad hoc, broad, and complex queries and analysis. The fifth key characteristic the design goal. The design goal of operational systems is that performance is throughput and the availability. The design goal of informational systems is the ease of flexible access and use. The sixth key characteristic of the difference is volume. The volume of operational systems consists of multiple constant updates and queries on one or a few table rows. The volume of informational systems consists of a periodic batch of updates and queries requiring many or all rows.
This shows that the two types of processing have vastly different characteristics in almost every category of comparison. What is particularly noticeable is that they have very different communities of users, because operational systems are used by salespersons, administrators, clerks, and others who need to process business transactions, while informational systems are used by executives, business analysts, managers, and increasingly by customers who are in search of status information or those who are decision makers.
The need to separate informational systems and operational systems is based on three key factors. The first factor is that a data warehouse tries to centralize data that is scattered throughout different operational systems and makes them easily available for decision support applications. The second factor is that a properly designed data warehouse can add value to data by increasing their quality and consistency. The third factor is that a separated data warehouse negates much of the contention for resources that would result when informational applications are competing with operational processing.
The success of data warehousing is not guaranteed. Data warehousing projects fail about forty percent of the time. This is because warehousing data is complex and requires cooperation and synchronization across an organization. For example, when errors become discovered in data that is loaded into the warehouse, the correct place to fix the errors will be in the source systems so bad data is not loaded again later. But the errors might be acceptable in the source system or even not considered errors by the unit of business for the source system. Many professional organizations sponsor yearly award programs to show the best data warehousing practices. The Data Warehousing Institute Awards is one of the most prestigious yearly award programs. There are many impressive winners from this award program. One of these winners is Continental Airlines, which won the award for the best enterprise data warehouse. The continental data warehouse had an actual-time architecture and had automated data transformations. What this did was simplify consolidated data from various source systems. A cross-unit-business system steering committee developed standard data definitions, also known as metadata. The uses of and changes to the warehouse have to be justified by profitability and revenue projections.
Ease of access is a necessity for companies that use collected data for their business. Many businesses function by using user data to create value for themselves or for other companies. Companies such as Google use user search data to tailor ads to the user’s interest. The ease of use provided by data warehouse interfaces allows for companies to perform their tasks more efficiently than if they had to access the data by hand. They do this by using an algorithm that queries their database through the interface and then analyzes the user search history to show ads to the user that might provoke a response. Some companies just collect the data and store it, selling it to advertising companies who use the data to send relevant information to users who fit certain criteria. These are just a couple of examples of what is possible with data warehouse queries and analysis.
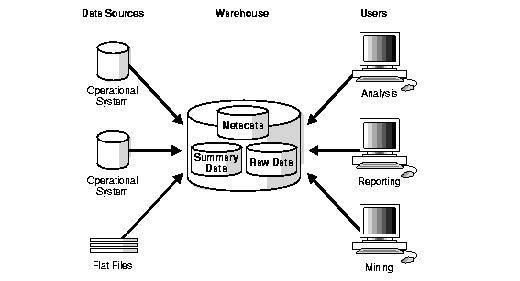
The architecture of a data warehouse is broken down into three levels; Data Sources, Warehouse, and users. The user-level of the data warehouse is where all of the analysis, reporting, and data mining happens. This is the level where most businesses operate, searching for and using the data for their intended purposes. The warehouse level is where the metadata, summary data, and raw data are stored. This allows for usage from the user level and for data deposits from the data sources level. This is the level that receives the most traffic because it handles the movement of data and the resorting after the reception and removal of data. The data sources level is where the data is generated, either through digital or real-world collection, and then stored in the warehouse level.
Each piece of data is categorized based on various criteria, depending on the type of data. For example, if the data came from a financial transaction, it would be sorted based on date, amount, sender, receiver, and status. The data is then put with data that has the same criteria, typically sorted by date. Once the data is stored it can be easily retrieved and aggregated into a list of data that all matches a list of requirements for analysis. This allows for the data to be easily accessed and sorted.
These warehouses hold information that has become important to the function of most companies, schools, banks, militaries, and governments. Data warehouses store information about equipment purchases, student class lists, transaction history, payment history, payroll, inventory listings, and employee information. Without efficient, organized ways to store all this information, companies and organizations wouldn’t be able to function. Stores wouldn’t be able to keep track of their stock so that they can remain stocked. Companies wouldn’t be able to manage and maintain payroll for their employees, keep track of what equipment is at what location, or what businesses placed orders for how much. Data storage, management, and organization have grown in importance to the point where most of modern society is dependent on the storage and reproduction of data.