Engineering LibreTexts

11.3: THz Spectroscopy and Imaging

  • Page ID
    44685
  • \( \newcommand{\vecs}[1]{\overset { \scriptstyle \rightharpoonup} {\mathbf{#1}} } \) \( \newcommand{\vecd}[1]{\overset{-\!-\!\rightharpoonup}{\vphantom{a}\smash {#1}}} \)\(\newcommand{\id}{\mathrm{id}}\) \( \newcommand{\Span}{\mathrm{span}}\) \( \newcommand{\kernel}{\mathrm{null}\,}\) \( \newcommand{\range}{\mathrm{range}\,}\) \( \newcommand{\RealPart}{\mathrm{Re}}\) \( \newcommand{\ImaginaryPart}{\mathrm{Im}}\) \( \newcommand{\Argument}{\mathrm{Arg}}\) \( \newcommand{\norm}[1]{\| #1 \|}\) \( \newcommand{\inner}[2]{\langle #1, #2 \rangle}\) \( \newcommand{\Span}{\mathrm{span}}\) \(\newcommand{\id}{\mathrm{id}}\) \( \newcommand{\Span}{\mathrm{span}}\) \( \newcommand{\kernel}{\mathrm{null}\,}\) \( \newcommand{\range}{\mathrm{range}\,}\) \( \newcommand{\RealPart}{\mathrm{Re}}\) \( \newcommand{\ImaginaryPart}{\mathrm{Im}}\) \( \newcommand{\Argument}{\mathrm{Arg}}\) \( \newcommand{\norm}[1]{\| #1 \|}\) \( \newcommand{\inner}[2]{\langle #1, #2 \rangle}\) \( \newcommand{\Span}{\mathrm{span}}\)\(\newcommand{\AA}{\unicode[.8,0]{x212B}}\)

    Photo-conductive switches activated by sub-100 fs pulses or optical rectification with sub-100 fs pulses leads to the generation of THz electro-magnetic impulses, that can be received with similar photo-conductive receivers or by electro-optic sampling [8][9]. This technique was pioneered by Ch. Fattinger and D. Grischkowsky [7].
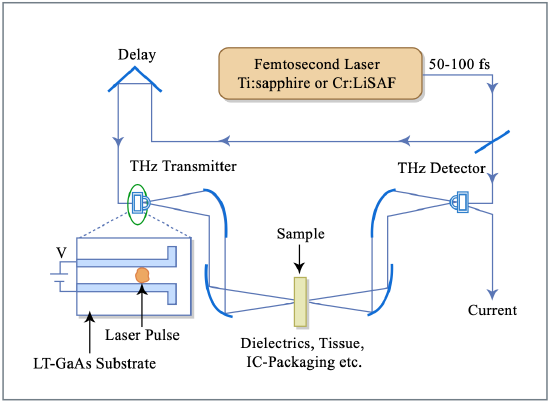
    截屏2021-07-17 下午9.33.49.png
    Figure 11.9: THz Time Domain Spectroscopy according to [8]

    Figure by MIT OCW.

    截屏2021-07-17 下午9.35.44.png
    Figure 11.10: THz Time Domain Spectroscopy using optical rectification in GaAs [9].

    Figure by MIT OCW.

    Figure 11.11: Terahertz waveforms modified by passage through (a) a 10mm block of stycast and (b) a chinese fortune cookie. The dashed lines show the shape of the input waveform multiplied by 0.5 in (a) and by 0.1 in 9b). In *a( the transmitted plse exhibits a strong "chirp" due to frequency-dependent index, while in (b), pulse broadening indicates preferential absorption of high frequencies [8].

    Figure 11.11 shows typical generated THz waveforms and distortions due to propagation through materials.


    This page titled 11.3: THz Spectroscopy and Imaging is shared under a CC BY-NC-SA 4.0 license and was authored, remixed, and/or curated by Franz X. Kaertner (MIT OpenCourseWare) via source content that was edited to the style and standards of the LibreTexts platform; a detailed edit history is available upon request.