
7.6: Information Diagrams
- Page ID
- 50200

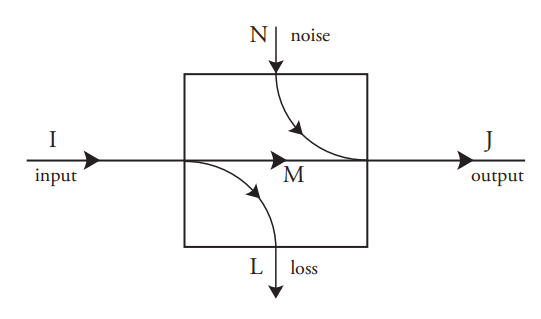
An information diagram is a representation of one or more processes explicitly showing the amount of information passing among them. It is a useful way of representing the input, output, and mutual information and the noise and loss. Information diagrams are at a high level of abstraction and do not display the detailed probabilities that give rise to these information measures.
It has been shown that all five information measures, \(I\), \(J\), \(L\), \(N\), and \(M\) are nonnegative. It is not necessary that \(L\) and \(N\) be the same, although they are for the symmetric binary channel whose inputs have equal probabilities for 0 and 1. It is possible to have processes with loss but no noise (e.g., the \(XOR\) gate), or noise but no loss (e.g., the noisy channel for triple redundancy).
It is convenient to think of information as a physical quantity that is transmitted through this process much the way physical material may be processed in a production line. The material being produced comes in to the manufacturing area, and some is lost due to errors or other causes, some contamination may be added (like noise) and the output quantity is the input quantity, less the loss, plus the noise. The useful product is the input minus the loss, or alternatively the output minus the noise. The flow of information through a discrete memoryless process is shown using this paradigm in Figure 7.9.
An interesting question arises. Probabilities depend on your current state of knowledge, and one observer’s knowledge may be different from another’s. This means that the loss, the noise, and the information transmitted are all observer-dependent. Is it OK that important engineering quantities like noise and loss depend on who you are and what you know? If you happen to know something about the input that
your colleague does not, is it OK for your design of a nondeterministic process to be different, and to take advantage of your knowledge? This question is something to think about; there are times when your knowledge, if correct, can be very valuable in simplifying designs, but there are other times when it is prudent to design using some worst-case assumption of input probabilities so that in case the input does not conform to your assumed probabilities your design still works.
Information diagrams are not often used for communication systems. There is usually no need to account for the noise sources or what happens to the lost information. However, such diagrams are useful in domains where noise and loss cannot occur. One example is reversible computing, a style of computation in which the entire process can, in principle, be run backwards. Another example is quantum communications, where information cannot be discarded without affecting the environment.