
4.2: Global and Regional Effects of Secondary Pollutants (I)
- Page ID
- 47172

The Earth is continuously receiving energy from the sun. Energy also leaves the Earth in the nighttime (of course in the form of invisible infrared energy!). Otherwise, the Earth would be continuously warming up. This delicate balance between the energy coming in and leaving due to natural greenhouse effect is what keeps the planet warm enough for us to live on.
It is very obvious that if more energy comes in than the energy that leaves, the planet will become warm. Similarly, if the energy that leaves is more than the energy that comes in, the planet will become cool. The atmospheric temperature fluctuates over centuries due to certain natural causes.
Greenhouse Effect
In an earlier chapter, we saw that energy can be transformed from one form to another, and during this conversion, all the energy that we put into a device comes out. However, all the energy that we put in may not come out in the desired form. An example of this is the greenhouse effect, which the following video discusses.
This Excel Sheet gives the current levels of CO2 in the atmosphere - 392 ppm in 2011.
Greenhouse Gases
The concentration of greenhouse gases in the atmosphere has been changing over the past 150 years. Since pre-industrial times atmospheric concentrations of the gases have increased:
- CO2 has climbed over 31 percent.
- CH4 has climbed over 151 percent.
- N2O has climbed 17 percent.
Scientists have confirmed that this is primarily due to human activities, which include burning coal, oil, and gas, and cutting down forests, depicted in Figure 4.2.1.
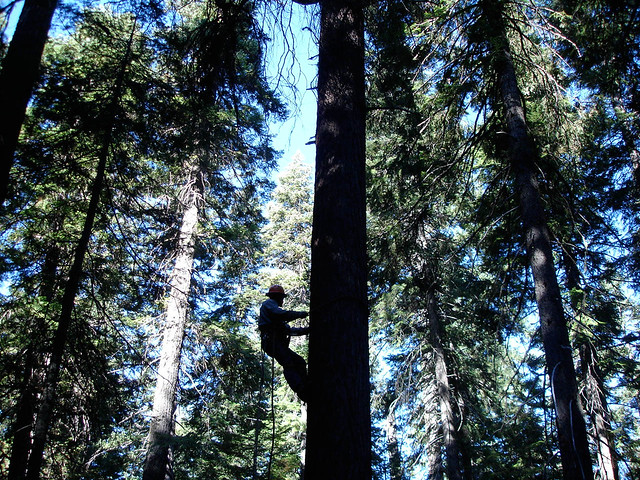
Figure 4.2.1: Lumberjack climbing a tree
Figure 4.2.2 gives the percentages of various gases found in greenhouse emissions.
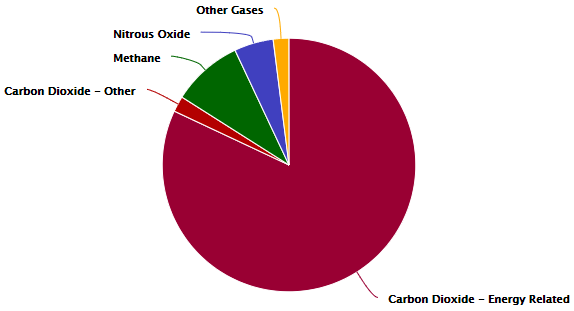
Figure 4.2.2: Distribution of emissions by greenhouse gases
The following list shows the greenhouse gasses and the source of emission:
- Carbon dioxide (CO2): Energy related CO2: 82% and Other CO2: 2%.
Produced by combustion of solid waste, fossil fuels, and wood and wood products. - Methane (CH4): 9%.
Source is the production and transport of coal, natural gas, and oil. Methane emissions also result from the decomposition of organic wastes in municipal solid waste landfills, and the raising of livestock. - Nitrous Oxide (N2O): 5%.
Produced by agricultural and industrial activities, as well as during combustion of solid waste and fossil fuels. - Other gases (CFC-12, HCFC-22, Perfluoromethane [CF4], and Sulfur Hexaflouride [SF6]): 2%.
Produced by industrial processes.
As you can see, energy related CO2 and CH4 accounts for 90 percent of the total greenhouse gas emissions in the United States. This highlights the impact of energy use on the environment.
How Has CO2 Concentration Changed?
Table 4.2.1 shows the change in greenhouse gas concentration between Pre-Industrial times and 2010, as well as the Atmospheric Lifetime and Global Warming Potential.
Table 4.2.1. Change in greenhouse gas concentration between pre-industrial times and 2010
| Greenhouse Gases | Pre-Industrial Concentration (PPBV) | 2010 Concentration (PPBV) | Atmospheric Lifetime (years) | Global Warming Potential (GWP) |
|---|---|---|---|---|
| CO2 | 278,000 | 390,000* | Variable | 1 |
| CH4 (methane) | 715 | 1810.5 | 12 | 25 |
| N2O (nitrous oxide) | 270 | 322.5 | 114 | 298 |
| CFC-12 | 0 | 0.533 | 100 | 10,900 |
| HCFC-22 | 0 | 0.208 | 12 | 1810 |
| CF4 (perfluoromethane)** | 0 | 0.007 | 50,000 | 6,500 |
| SF6 (sulfur hexafluoride) | 0 | 0.007 | 3,200 | 22,800 |
*Recent CO2 concentration (390.5 ppm) is the 2011 average taken from globally averaged marine surface data given by the National Oceanic and Atmospheric Administration Earth System Research Laboratory.
**2005 data
Source: CDIAC.org
Additional Information
Atmospheric lifetime is the period of time during which a gas changes and is either transformed or removed from the atmosphere.
GWP is an index defined as the cumulative radiative forcing (infrared radiation absorption) between the present and some chosen time horizon caused by a unit mass of gas emitted now, expressed relative to a reference gas such as CO2, as is used here. GWP is an attempt to provide a simple measure of the relative radiative effects of different greenhouse gases.
Figure 4.2.3 shows how the amounts of greenhouse gases in the atmosphere have changed over time. The increase in the greenhouse gases between 1950 and 2010 is believed to have caused an increase in the global temperature. The mean increase in the global temperature over the past one century is about 1 degree Fahrenheit.
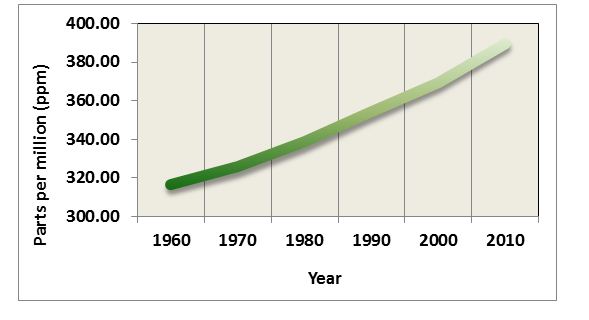
Figure 4.2.3: Greenhouse gas emissions from 1950 to 2010
Additional Information
Data from the graph above was obtained from ice core samples of trapped air. More specifically, ice in the Polar Regions traps air from that particular time period, and then new ice is deposited over the previously deposited ice, trapping more air from the past. Thus, the analysis of ice core samples provides the composition of past air, which can be used to determine the past temperatures.
The increase in the greenhouse gases between 1950 and 2010 is believed to have caused an increase in the global temperature, as depicted in Figure 4.2.4. The mean increase in the global temperature over the past one century is about 1°F.
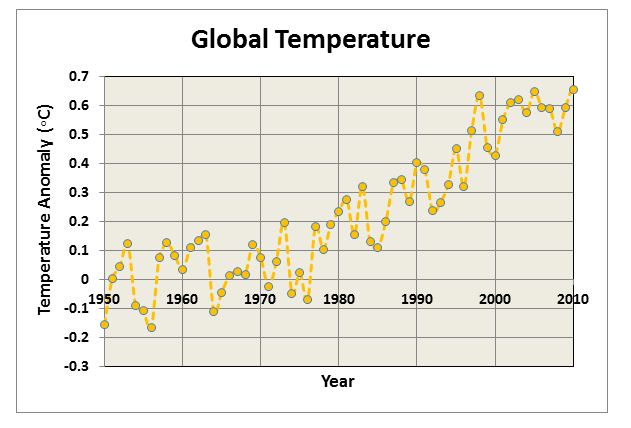
Figure 4.2.4: Global annual surface temperature from 1950 to 2010
Additional Information
Since 1880, about when the industrial age first started, the average increase in global temperature has been 1°F.
Not only has there been an increase in temperatures with the increase of greenhouse gasses, there has also been an increase in CO2 emissions from fossil fuels – this has been apparent over the last 150 years (since about 1850).
The graph below depicts data from ice core samples showing temperature and CO2 concentrations in the atmosphere from 400,000 years ago to about the year 2000.
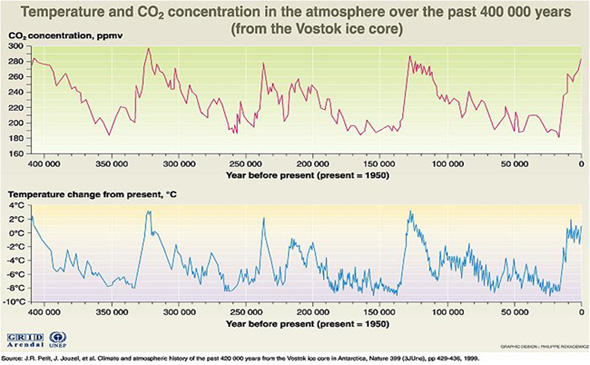
Figure 4.2.5: Global temperature and CO2 concentration changes over the past 400,000 years
Important Point
Based on the graph above, it can be determined that during periods of time where there was no human activity:
- The average global temperature increase was 2°C or 4°F.
- The average temperature decrease was 8°C or 17°F.
CO2 and Temperature Fluctuations
Unanswered Question
We have seen that there have been fluctuations in both temperature and CO2 emissions in the past 400,000 years. This leads to an important question:
- Did the atmospheric CO2 concentrations and temperatures change prior to the pre-industrial period or only after it?
Or more specifically:
- If we attribute the mean global temperature increase of 1ºF over the past century to human activities, how do we explain the mean global temperature fluctuations between +4ºF to -17ºF that occurred thousands of years ago, when there was no human activity?
Possible Answer
Some argue that temperature change is natural and cyclical. Thus, since it is cyclical, we, the humans, might not be influencing the current change in the climate.
The most important difference between now and then that we have to keep in mind is the human species. More than six billion people live on this planet now, who were not there during those earlier natural temperature cycles, and any chances that jeopardize the existence of this humankind must be taken seriously. The reasons for concern are discussed next.
Important Point
More than 6 billion people live on this planet now who were not here during the earlier natural temperature cycles, and any chances that jeopardize the existence (land and food supply) of this humankind must be taken seriously.
The significant temperature fluctuations shown in the earlier graph of the ice core samples led to the glacial and inter-glacial ice ages. The temperature increase over the last 150 years, however, is not significant compared to the changes in the past known history. Figure 4.2.6 shows the CO2 profile.
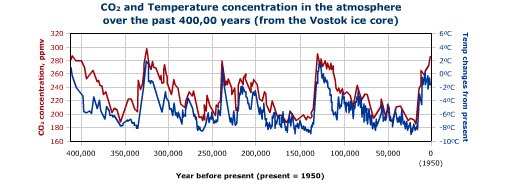
Figure 4.2.6: CO2 concentration over time
From Figure 4.2.6, we know that CO2 concentration did not rise above 310 ppmv at any time from 400,000 years ago to the year 1950, even though the temperatures continued to increase. Based on this information, we can conclude that this increase is something that the atmosphere did not experience earlier, which means that the increase is the result of human activity.
Now let’s look at how CO2 concentration and temperature have changed in the last 50 years, since 1960, as shown in Figure 4.2.7.

Figure 4.2.7: CO2 concentration vs. temperature change graph
Based on your observations of the above graph, reflect on the questions discussed below:
- In the past, 310 ppm of CO2 increased the temperature by about 4 degrees F, so how do you think the current CO2 concentration of 370 ppm is impacting the temperature?
- How long will it take for the temperature to come to a level that corresponds to the CO2 concentration of 370 ppm? Or are we already there?
- What will the consequences be if the concentration of CO2 increases to 550 ppm (double the pre-industrial concentration), or even to 70 ppm (both of which are proposed to be likely scenarios with the increased fossil fuel consumption?)
If the temperature already reached the maximum temperature corresponding to 370 ppm, then some other factors are cooling the planet that were absent in the previous cycles.
Now, let’s examine the reasons or causes for the natural fluctuations.
Global Warming
The sun is the main source of energy and, as we discussed earlier, it is the net balance between the incoming solar energy and the outgoing energy that causes the temperature changes.
The Earth is continuously moving around the sun. Based on its position, the incoming energy changes. The Earth’s axis of rotation is tilted at an angle of 23.5°, and this tilt goes from one side to the other and back over in 40,000-year cycles. Earth’s axis of rotation takes about 21,000 years to complete a cycle.
The following video shows the earth’s movement around the sun.
The Earth’s orbit around the sun changes from a circular path to an elliptical path and back to a circular path over 100,000 years. These are long-term changes. On a much shorter term, the radiation from the sun can be affected by the activity on the surface of the sun. Sun spots (intense flares on the surface) can increase the radiation from the sun. The increase in the solar activity occurs over an 11-year cycle.
Like many fields of scientific study, there are uncertainties associated with the science of global warming. This does not imply that all things are equally uncertain. Some aspects of the science are based on well-known physical laws and documented trends, while other aspects range from 'near certainty' to 'big unknowns.'
In the following sections, we will discuss the following:
- What is known for certain? Human activities change the Earth's Atmosphere.
- What is likely? Greenhouse gases contribute to global warming. Several factors impact temperature (clouds, fine particles, oceans). Global Warming affects health, water resources, polar regions, coastal zones and forests.
- What is uncertain? The long term effects of global warming, especially for smaller areas.