
17.4: Assessment of Alternative Pickup and Dropoff Points
- Page ID
- 31032

The impact of alternative pickup and dropoff points was assessed as follows.
17.4.1 Identify Root Causes and Assess Initial Alternatives
The assessment of the new AGV system design can be done in the following way. Note from Figure 17-2 that there are two types of workstations. The pickup and dropoff points for workstations B, C, D, E, and F are located near each other. The pickup and dropoff points for workstations G, H, and I are separate. Workstation A has only a pickup point.
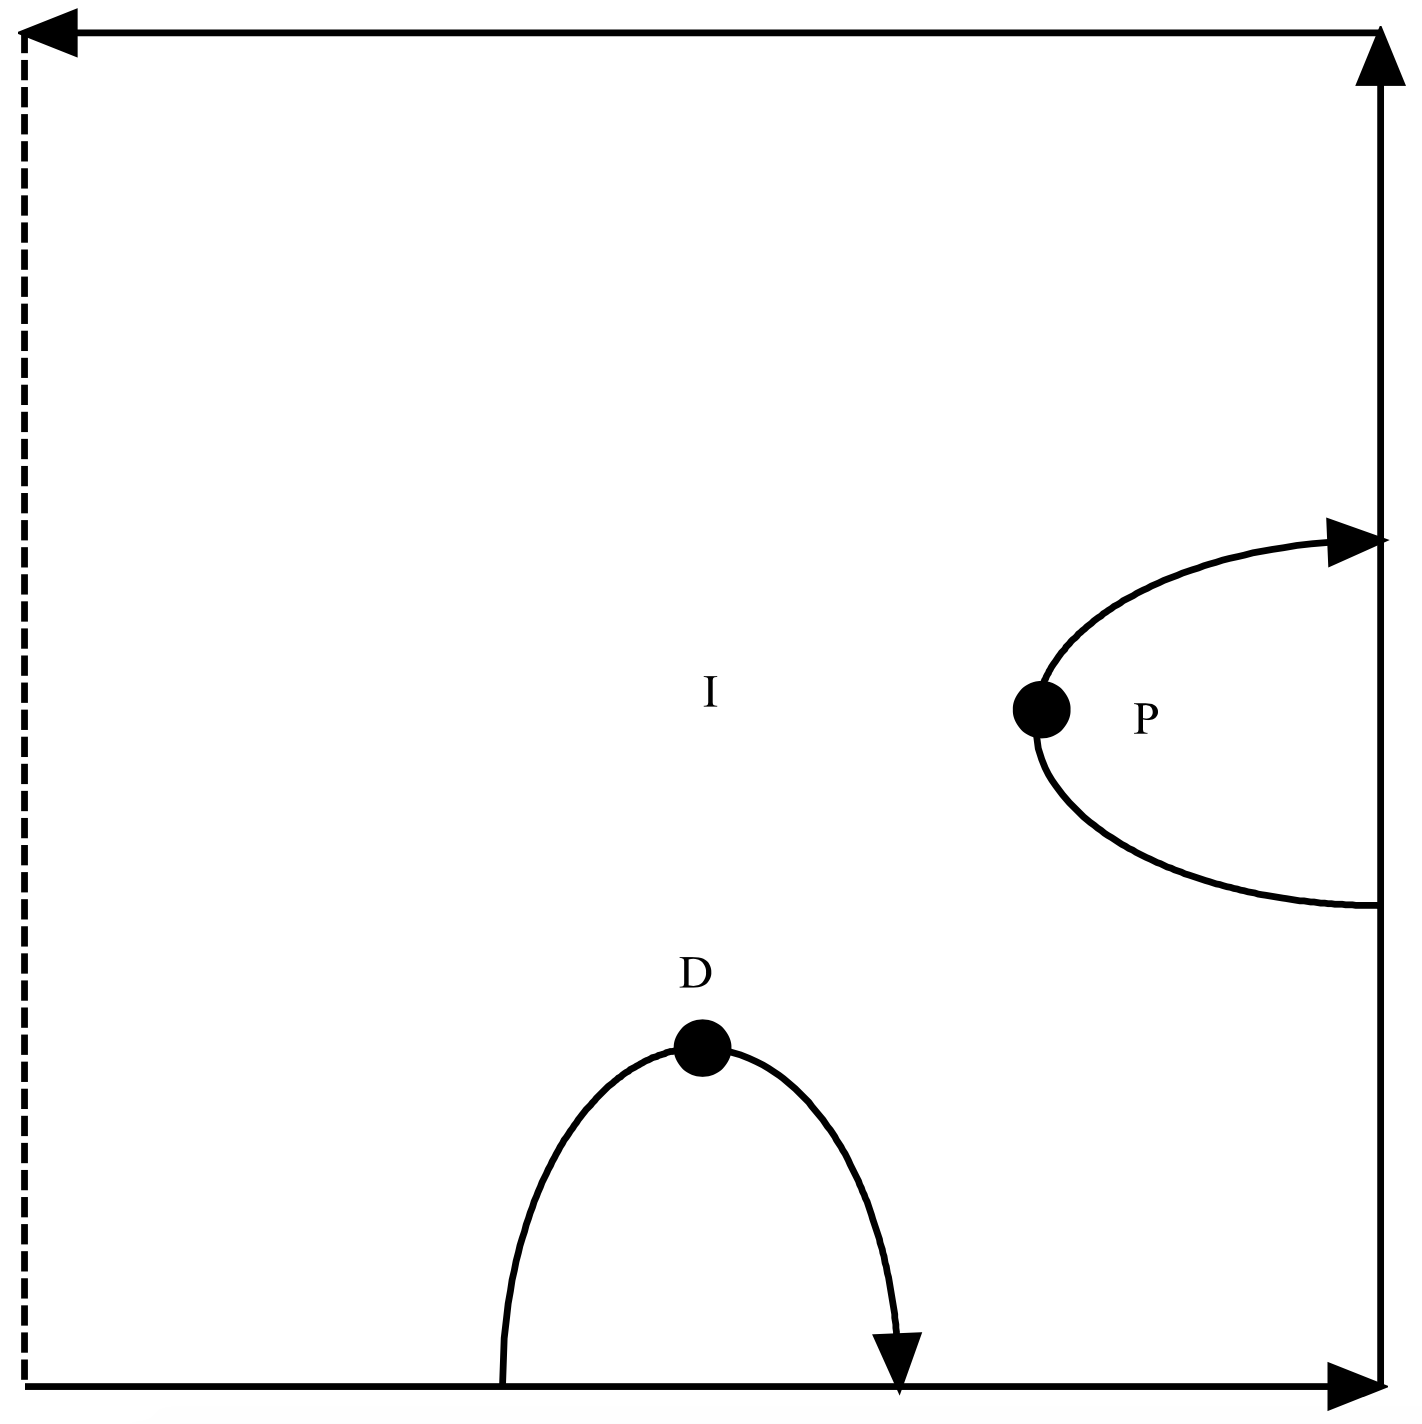
Figure 17-3 shows the redesign of the pickup and dropoff points for workstations B, C, D, E, and F. Figure 17-4 shows the redesign for the remaining stations. Note that the AGV's have a greater distance to travel to both pickup and dropoff a load since a loop of about 15 feet must be traversed into each workstation.
Figure 17-3: Example Workstation Layout with Pickup and Dropoff Points within the Workstation -- Style 1.
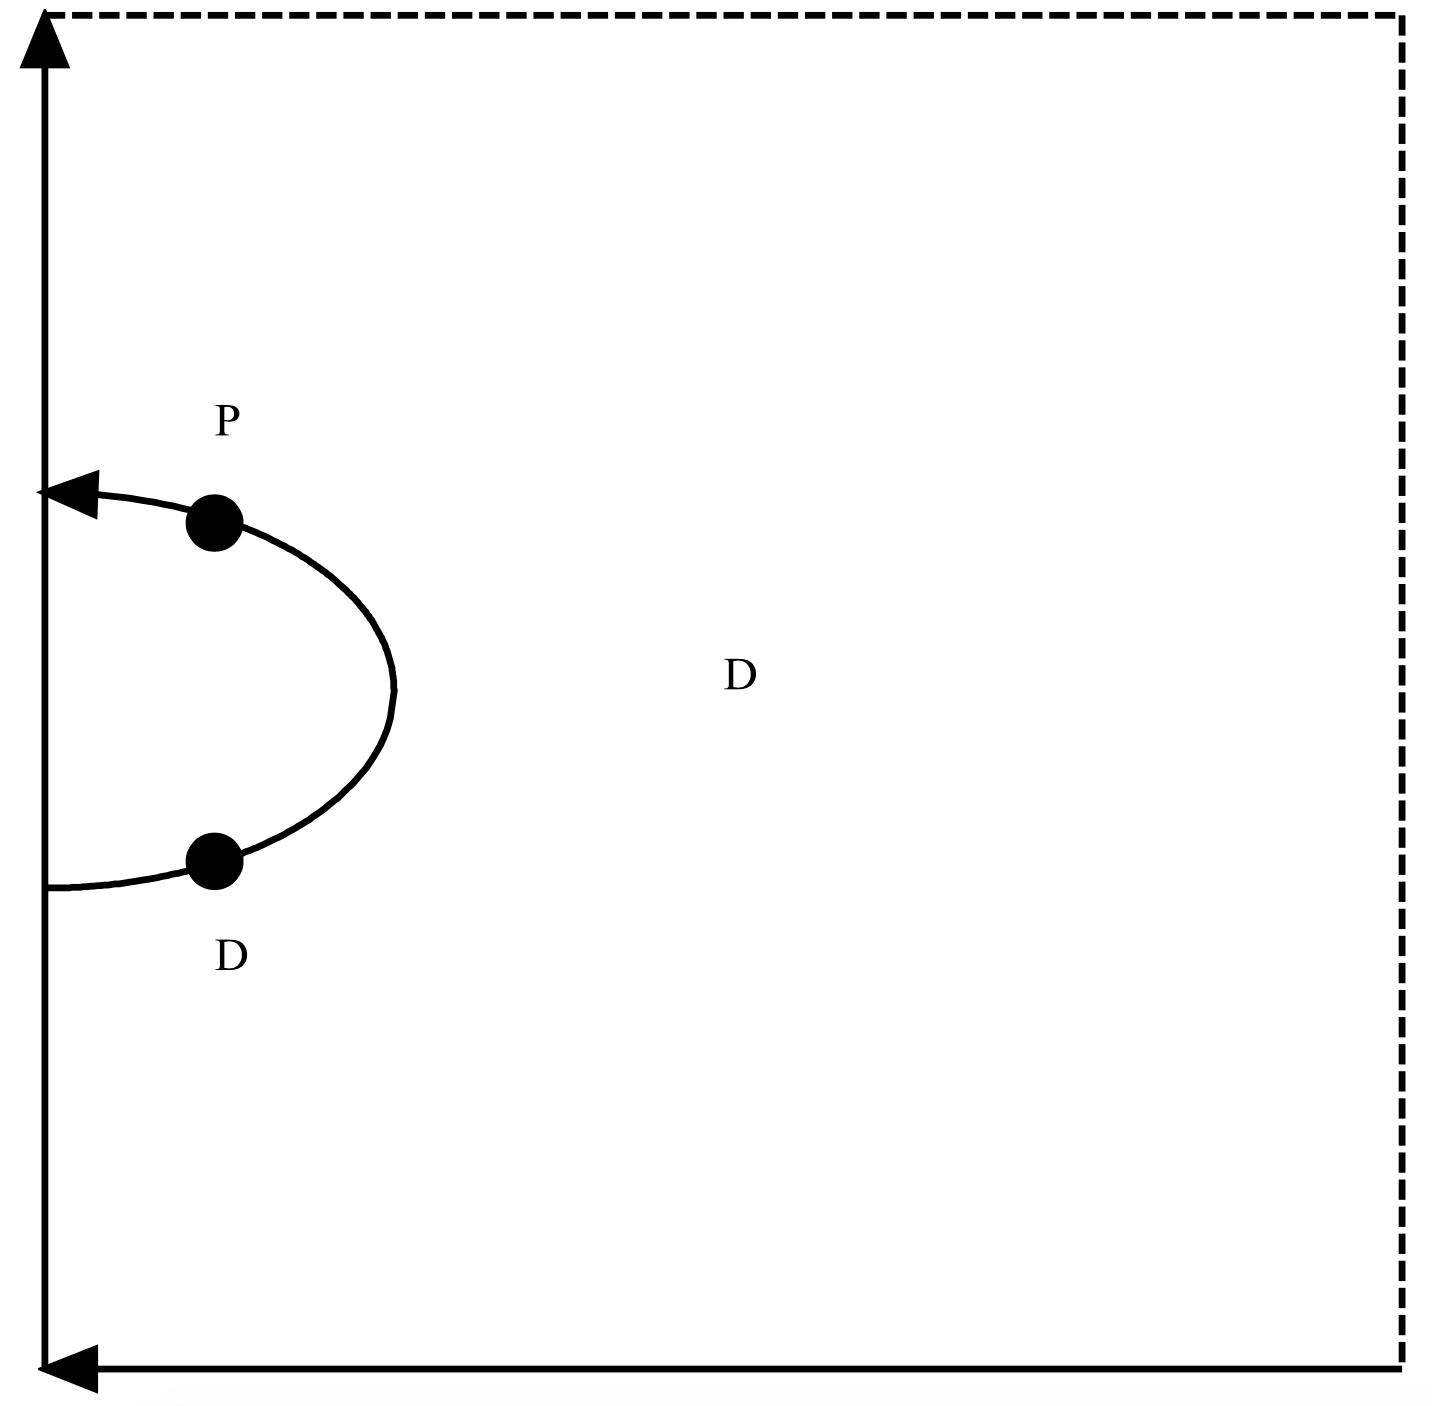
Figure 17-4: Example Workstation Layout with Pickup and Dropoff Points within the Workstation -- Style2.
A new simulation experiment can be executed. The design is the same as shown in Table 17-2 except that the operation of the modified AGV layout with three AGV's only will be assessed. Note that the model does not need to be modified since the AGV layout is input data expressed as a graphical drawing. Simulation results for this experiment are shown in Table 17-6.
The following can be noted from Table 17-6.
- AGV utilization is near 72%.
- Only a little congestion occurs since about 13% of the available time of 1 AGV is lost.
- The average time to move a load is about 3 minutes.
- The maximum time to move a load is about (10.3, 28.1) minutes with approximately 99% confidence. The average maximum is 19.2 minutes. The range of the maximum times across the replicates is (5.3, 56.8) minutes.
| AGV’s | Time to Complete a Move (min) | |||
| Replicate | Idle Percent | Percent Congested | Maximum | Average |
| 1 | 26.4% | 4.9% | 3.3 | 38.3 |
| 2 | 27.6% | 3.9% | 2.8 | 10.0 |
| 3 | 28.1% | 4.4% | 2.8 | 12.2 |
| 4 | 28.6% | 4.5% | 2.9 | 33.2 |
| 5 | 27.9% | 4.5% | 2.8 | 5.3 |
| 6 | 28.4% | 3.6% | 2.8 | 12.5 |
| 7 | 28.6% | 3.5% | 2.7 | 5.3 |
| 8 | 28.2% | 4.0% | 2.9 | 23.3 |
| 9 | 28.6% | 4.1% | 2.9 | 32.9 |
| 10 | 28.3% | 3.6% | 2.8 | 16.3 |
| 11 | 28.3% | 4.3% | 2.9 | 22.4 |
| 12 | 26.6% | 3.9% | 3.2 | 32.5 |
| 13 | 27.3% | 4.9% | 3.5 | 56.8 |
| 14 | 28.4% | 4.2% | 2.8 | 11.5 |
| 15 | 28.4% | 4.8% | 2.8 | 18.6 |
| 16 | 28.4% | 4.2% | 2.7 | 7.5 |
| 17 | 28.3% | 5.8% | 2.9 | 25.5 |
| 18 | 28.5% | 3.9% | 2.7 | 7.8 |
| 19 | 27.6% | 3.7% | 2.8 | 5.4 |
| 20 | 27.8% | 4.4% | 2.8 | 6.8 |
| Average | 28.0% | 4.3% | 2.9 | 19.2 |
| Std. Dev. | 0.6% | 0.6% | 0.2 | 13.9 |
| 99% CI Lower Bound | 27.6% | 3.9% | 2.8 | 10.3 |
| 99% CI Upper Bound | 28.4% | 4.6% | 3.0 | 28.1 |
Table 17-7 contains a comparison of AGV system operations using the initial system design and the new system design each employing 3 AGV's.
| AGV’s (New-Original) | Time to Complete a Move (min) (New-Original) | |||
| Replicate | Idle Percent | Percent Congested | Maximum | Average |
| 1 | 5.1% | -7.9% | -4.5 | 35.2 |
| 2 | 6.6% | -8.1% | -4.8 | 6.9 |
| 3 | 5.3% | -7.3% | -6.3 | 9.2 |
| 4 | 7.1% | -7.0% | -9.1 | 30.1 |
| 5 | 6.6% | -7.6% | -5.8 | 2.2 |
| 6 | 7.3% | -8.4% | -7.1 | 9.4 |
| 7 | 7.8% | -8.3% | -5.4 | 2.2 |
| 8 | 6.7% | -7.5% | -6.4 | 20.2 |
| 9 | 7.3% | -7.9% | -6.4 | 29.8 |
| 10 | 6.2% | -7.9% | -6.2 | 13.2 |
| 11 | 7.6% | -8.3% | -6.2 | 19.2 |
| 12 | 4.5% | -7.0% | -5.1 | 29.4 |
| 13 | 6.1% | -7.1% | -5.3 | 53.7 |
| 14 | 7.9% | -8.4% | -5.7 | 8.3 |
| 15 | 6.1% | -6.6% | -6.7 | 15.5 |
| 16 | 5.5% | -7.6% | -5.8 | 4.5 |
| 17 | 6.9% | -6.0% | -6.2 | 22.3 |
| 18 | 7.1% | -8.1% | -7.8 | 4.7 |
| 19 | 6.4% | -8.1% | -6.5 | 2.3 |
| 20 | 4.8% | -6.1% | -5.6 | 3.8 |
| Average | 6.4% | -7.6% | -6.1 | 16.1 |
| Std. Dev. | 1.0% | 0.7% | 1.0 | 13.8 |
| 99% CI Lower Bound | 5.8% | -8.0% | -6.8 | 7.2 |
| 99% CI Upper Bound | 7.1% | -7.1% | -5.5 | 25.0 |
The following can be noted from Table 17-7.
- AGV utilization increases as the average congestion increases for the new system configuration versus the original configuration. These difference are both significant with approximately 99% confidence. Note that both differences are small.
- There is little difference in the average time to move a load between the two designs, though the difference is statistically significant.
- The difference in the maximum time to move a load is operationally and statisically significant. The approximate 99% confidence interval is wide. The maximum difference is at least 29 minutes in 5 of 20 replicates.
17.4.2 Review and Extend Previous Work
Management rejected the new AGV system design. It was recognized that this design is more complex than the orginal which will require a more complex control system. AGV utilization and congestion as well as the average load delivery time were about the same for either design. The possible increase in maximum delivery time was of concern.
17.4.3 Implement the Selected Solution and Evaluate
The original system configuration with three AGV's will be implemented and the maximum time to move a load monitored.