
14.2: Measurement of Texture
- Page ID
- 7872
")
\( \newcommand{\vecs}[1]{\overset { \scriptstyle \rightharpoonup} {\mathbf{#1}} } \)
\( \newcommand{\vecd}[1]{\overset{-\!-\!\rightharpoonup}{\vphantom{a}\smash {#1}}} \)
\( \newcommand{\dsum}{\displaystyle\sum\limits} \)
\( \newcommand{\dint}{\displaystyle\int\limits} \)
\( \newcommand{\dlim}{\displaystyle\lim\limits} \)
\( \newcommand{\id}{\mathrm{id}}\) \( \newcommand{\Span}{\mathrm{span}}\)
( \newcommand{\kernel}{\mathrm{null}\,}\) \( \newcommand{\range}{\mathrm{range}\,}\)
\( \newcommand{\RealPart}{\mathrm{Re}}\) \( \newcommand{\ImaginaryPart}{\mathrm{Im}}\)
\( \newcommand{\Argument}{\mathrm{Arg}}\) \( \newcommand{\norm}[1]{\| #1 \|}\)
\( \newcommand{\inner}[2]{\langle #1, #2 \rangle}\)
\( \newcommand{\Span}{\mathrm{span}}\)
\( \newcommand{\id}{\mathrm{id}}\)
\( \newcommand{\Span}{\mathrm{span}}\)
\( \newcommand{\kernel}{\mathrm{null}\,}\)
\( \newcommand{\range}{\mathrm{range}\,}\)
\( \newcommand{\RealPart}{\mathrm{Re}}\)
\( \newcommand{\ImaginaryPart}{\mathrm{Im}}\)
\( \newcommand{\Argument}{\mathrm{Arg}}\)
\( \newcommand{\norm}[1]{\| #1 \|}\)
\( \newcommand{\inner}[2]{\langle #1, #2 \rangle}\)
\( \newcommand{\Span}{\mathrm{span}}\) \( \newcommand{\AA}{\unicode[.8,0]{x212B}}\)
\( \newcommand{\vectorA}[1]{\vec{#1}} % arrow\)
\( \newcommand{\vectorAt}[1]{\vec{\text{#1}}} % arrow\)
\( \newcommand{\vectorB}[1]{\overset { \scriptstyle \rightharpoonup} {\mathbf{#1}} } \)
\( \newcommand{\vectorC}[1]{\textbf{#1}} \)
\( \newcommand{\vectorD}[1]{\overrightarrow{#1}} \)
\( \newcommand{\vectorDt}[1]{\overrightarrow{\text{#1}}} \)
\( \newcommand{\vectE}[1]{\overset{-\!-\!\rightharpoonup}{\vphantom{a}\smash{\mathbf {#1}}}} \)
\( \newcommand{\vecs}[1]{\overset { \scriptstyle \rightharpoonup} {\mathbf{#1}} } \)
\(\newcommand{\longvect}{\overrightarrow}\)
\( \newcommand{\vecd}[1]{\overset{-\!-\!\rightharpoonup}{\vphantom{a}\smash {#1}}} \)
\(\newcommand{\avec}{\mathbf a}\) \(\newcommand{\bvec}{\mathbf b}\) \(\newcommand{\cvec}{\mathbf c}\) \(\newcommand{\dvec}{\mathbf d}\) \(\newcommand{\dtil}{\widetilde{\mathbf d}}\) \(\newcommand{\evec}{\mathbf e}\) \(\newcommand{\fvec}{\mathbf f}\) \(\newcommand{\nvec}{\mathbf n}\) \(\newcommand{\pvec}{\mathbf p}\) \(\newcommand{\qvec}{\mathbf q}\) \(\newcommand{\svec}{\mathbf s}\) \(\newcommand{\tvec}{\mathbf t}\) \(\newcommand{\uvec}{\mathbf u}\) \(\newcommand{\vvec}{\mathbf v}\) \(\newcommand{\wvec}{\mathbf w}\) \(\newcommand{\xvec}{\mathbf x}\) \(\newcommand{\yvec}{\mathbf y}\) \(\newcommand{\zvec}{\mathbf z}\) \(\newcommand{\rvec}{\mathbf r}\) \(\newcommand{\mvec}{\mathbf m}\) \(\newcommand{\zerovec}{\mathbf 0}\) \(\newcommand{\onevec}{\mathbf 1}\) \(\newcommand{\real}{\mathbb R}\) \(\newcommand{\twovec}[2]{\left[\begin{array}{r}#1 \\ #2 \end{array}\right]}\) \(\newcommand{\ctwovec}[2]{\left[\begin{array}{c}#1 \\ #2 \end{array}\right]}\) \(\newcommand{\threevec}[3]{\left[\begin{array}{r}#1 \\ #2 \\ #3 \end{array}\right]}\) \(\newcommand{\cthreevec}[3]{\left[\begin{array}{c}#1 \\ #2 \\ #3 \end{array}\right]}\) \(\newcommand{\fourvec}[4]{\left[\begin{array}{r}#1 \\ #2 \\ #3 \\ #4 \end{array}\right]}\) \(\newcommand{\cfourvec}[4]{\left[\begin{array}{c}#1 \\ #2 \\ #3 \\ #4 \end{array}\right]}\) \(\newcommand{\fivevec}[5]{\left[\begin{array}{r}#1 \\ #2 \\ #3 \\ #4 \\ #5 \\ \end{array}\right]}\) \(\newcommand{\cfivevec}[5]{\left[\begin{array}{c}#1 \\ #2 \\ #3 \\ #4 \\ #5 \\ \end{array}\right]}\) \(\newcommand{\mattwo}[4]{\left[\begin{array}{rr}#1 \amp #2 \\ #3 \amp #4 \\ \end{array}\right]}\) \(\newcommand{\laspan}[1]{\text{Span}\{#1\}}\) \(\newcommand{\bcal}{\cal B}\) \(\newcommand{\ccal}{\cal C}\) \(\newcommand{\scal}{\cal S}\) \(\newcommand{\wcal}{\cal W}\) \(\newcommand{\ecal}{\cal E}\) \(\newcommand{\coords}[2]{\left\{#1\right\}_{#2}}\) \(\newcommand{\gray}[1]{\color{gray}{#1}}\) \(\newcommand{\lgray}[1]{\color{lightgray}{#1}}\) \(\newcommand{\rank}{\operatorname{rank}}\) \(\newcommand{\row}{\text{Row}}\) \(\newcommand{\col}{\text{Col}}\) \(\renewcommand{\row}{\text{Row}}\) \(\newcommand{\nul}{\text{Nul}}\) \(\newcommand{\var}{\text{Var}}\) \(\newcommand{\corr}{\text{corr}}\) \(\newcommand{\len}[1]{\left|#1\right|}\) \(\newcommand{\bbar}{\overline{\bvec}}\) \(\newcommand{\bhat}{\widehat{\bvec}}\) \(\newcommand{\bperp}{\bvec^\perp}\) \(\newcommand{\xhat}{\widehat{\xvec}}\) \(\newcommand{\vhat}{\widehat{\vvec}}\) \(\newcommand{\uhat}{\widehat{\uvec}}\) \(\newcommand{\what}{\widehat{\wvec}}\) \(\newcommand{\Sighat}{\widehat{\Sigma}}\) \(\newcommand{\lt}{<}\) \(\newcommand{\gt}{>}\) \(\newcommand{\amp}{&}\) \(\definecolor{fillinmathshade}{gray}{0.9}\)In the past, optical methods and etching have been used to determine grain orientation, but recently texture is almost exclusively measured by diffraction techniques. Diffraction of x-rays, electrons, and neutrons will all be discussed in this TLP.
X-ray diffraction
The most common method of measuring texture uses x-ray diffraction and is known as the “Schultz reflection method”. The apparatus used is known as a four-angle diffractometer or a Eulerian cradle.
The source of x-rays and the detector are oriented so that a particular value of 2θ is specified. This allows for a single Bragg reflection to be measured. The stage of the cradle is tilted and rotated systematically, so that all angular orientations of the sample are investigated.
The animation below shows how the Eulerian cradle is used for measurement of texture using the reflection method.
When the specified lattice plane of a crystallite fulfils the Bragg condition, the detector will record the reflection. For a polycrystalline material, the intensity of detected x-rays will increase when there are more crystallites in a specific orientation. The intensity for a given orientation is proportional to the volume fraction of crystallites with that orientation. Areas of high and low intensity suggest a preferred orientation, while constant intensity at all angles would occur in a random polycrystalline aggregate.
X-ray diffraction may be carried out so that the x-rays are reflected from the surface of the sample, or they may penetrate via transmission. Transmission is only suitable for thin films or wires because of the high absorption of the x-rays by many materials.
In some materials the bulk and surface textures may be different, e.g. in some rolled textures. Therefore, it is important to identify which texture is of interest. Different sources of radiation can lead to different degrees of penetration, and hence allow the measurement of either bulk or surface textures.
Electron Backscatter Diffraction (EBSD)
An alternative method of texture determination is that of electron backscattered microscopy using a scanning electron microscope. Within a single grain, the electron beam is fixed at a point on the surface. At particular angles the beam is diffracted, so that there is a change in the intensity of the reflection measured. This leads to the formation of a backscatter Kikuchi pattern made up of Kikuchi lines.
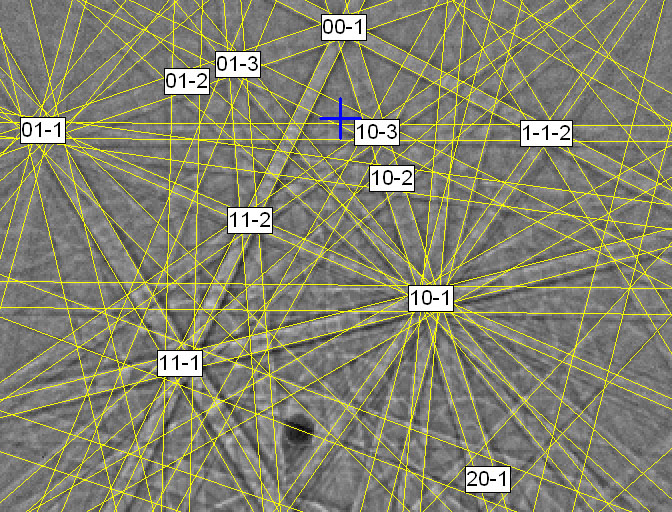
Boron doped (001) Si wafer. The blue cross is at 90° to the incident electron beam. The wafer is oriented so that [00] is normal to the stage. The stage is held at an angle of 70°, so that the blue cross is 20° from the stage normal. Poles are determined and plotted by the commercial EBSD software using symmetry and vector addition considerations. Image courtesy of Dr Jeff Wheeler.
The location and symmetry of the backscatter Kikuchi pattern allows specific bands of Kikuchi lines to be indexed unambiguously. The indexed patterns are used to describe the orientation of the grain within typically an experimental error of ±2°.
The information stored by the commercial software using this method includes specimen coordinates as well as the crystal orientation. Therefore, it is possible to build up a two dimensional map of the orientation of grains on the surface of a polycrystalline material.
In this image of recrystallised stainless steel, grains, annealing twins and grain boundaries are apparent.
The orientation at each pixel in the image is represented by a different colour. Each coloured pixel is defined by a single EBSD measurement. The colours can be separated into their red, green, and blue constituents by fractal analysis. The orientation of the crystal can be determined from the key. Each grain orientation is described with reference to an external frame of reference. Here, the orthogonal axes of the external frame of reference with respect to which the grain orientations are defined are (i) the direction normal to the plane of the sheet, (ii) the direction parallel to the tensile axis, and (iii) the transverse direction parallel to the plane of the sheet.
Thus, for example, there is a large grain coloured mostly red in the lower left-hand corner of the picture. Within this grain there are subtle changes in rotation giving rise to regions which are more orange than red in colour: this indicates the occurrence of low-angle sub-grain boundaries within this large grain. More significantly, there are grey, green and blue-grey regions abutting this red grain. Each of these three regions is twinned with respect to the red grain.
Neutron diffraction
Neutron diffraction can be used in a similar way to x-ray diffraction. There is a large reduction in absorption but a much higher angular resolution in neutron diffraction in comparison with x-ray diffraction. In-situ texture changes due to environmental factors (e.g. temperature changes and stress) can be measured using neutron diffraction.