
3.3: Real gas and compressibility factor
- Page ID
- 88835

\[P-v-T\]
The compressibility factor is a dimensionless correction factor to account for the deviation of the real gas behaviour from the “ideal” gas model. It is defined as
\[Pv = ZRT\]
where
\[Z\]
\[v\]
\[T\]
\[P\]
\[R\]
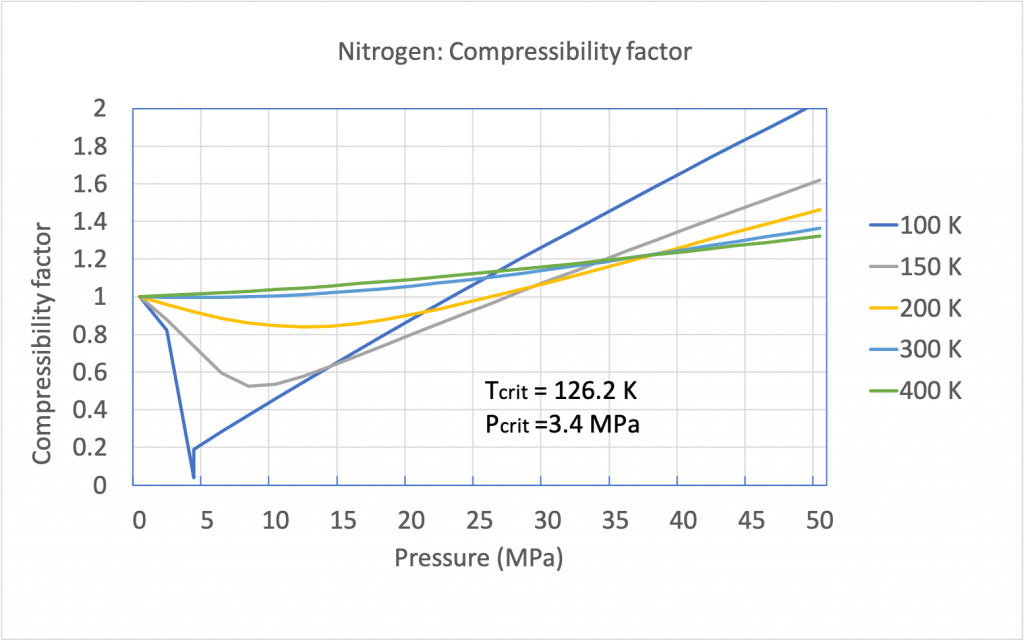
The compressibility factor of an ideal gas is exactly one. For real gases, the compressibility factor may be very different from one. Figures 3.2.1 and 3.2.2 illustrate the compressibility factors of hydrogen and nitrogen, respectively, over a range of pressures and temperatures. It can be seen that the compressibility factor changes with both pressure and temperature. As the pressure approaches zero, the compressibility factor tends to converge to one. In other words, a real gas may behave like an ideal gas at “low” pressures regardless of its temperature.
From Figures 3.2.1 and 3.2.2, it can be seen that the compressibility charts for different gases may vary largely. It is therefore more practical to use a generalized compressibility chart, as shown in Figure 3.2.3, where the pressures and temperatures are normalized with respect to the critical pressure and critical temperature of a gas. The reduced pressure  and reduced temperature
  are defined as
where
 : pressure, in kPa or Pa
 : critical pressure, in kPa or Pa. and must have the same unit.: reduced pressure, dimensionless
 : absolute temperature, in K
 : critical temperature, in K: reduced temperature, dimensionless
The compressibility factor is thus plotted as a function of and . The generalized compressibility chart can be viewed as a graphical representation of the gas behaviour over a wide range of pressures and temperatures. It is valid for many substances, especially those that have simple molecular structures. From Figure 3.2.3, it can be seen that the smallest compressibility factor occurs at the critical point,  and
and  . This indicates that a real gas deviates significantly from the ideal gas behaviour near its critical point. As
  or
or  , the compressibility factor
  . In other words, a real gas behaves like an ideal gas at “low” pressures and “high” temperatures.

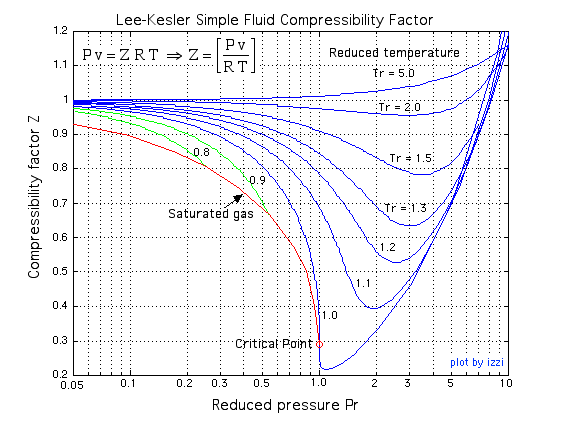
Typically, thermodynamic tables or real-gas EOS are used for evaluating the relation of pressure, temperature, and specific volume of real gases. If neither tool is available, the generalized compressibility chart may be used instead as a fast and reasonably accurate tool, especially for substances with simple molecular structures. Below is the procedure of how to use the generalized compressibility chart, followed by examples.
- Find the critical pressure, , and critical temperature, , of a substance from Appendix E
- Calculate the reduced pressure, , and reduced temperature, , of the substance at the given condition
- Estimate the compressibility factor,
 , from Figure 3.2.3.
 - Apply
 to determine the unknown specific volume (if needed)
Find the compressibility factor of the following substances at the given conditions. Is it reasonable to treat them as ideal gases at the given conditions?
- Methane at -50oC, 4.1 MPa
- Ammonia at 600oC, 500 kPa
Solution
1. Methane at -50oC, 4.1 MPa
First, find the critical properties of methane from Table E1.
\[T_{crit}= 190.6 \ \rm{K}\]
Second, calculate the reduced temperature and reduced pressure.
\[T_r = \displaystyle \frac{T}{T_{crit}} = \frac{273.15 - 50}{190.6} = 1.17\]
\[P_r = \displaystyle \frac{P}{P_{crit}} = \frac{4.10}{4.60} = 0.89\]
From Figure 3.2.3, the compressibility factor  ; therefore, methane at the given condition cannot be treated as an ideal gas.
2. Ammonia at 600oC, 500 kPa
First, find the critical properties of ammonia from Table E1.
\[T_{crit}= 405.4 \ \rm{K}\]
Second, calculate the reduced temperature and reduced pressure.
\[T_r = \displaystyle \frac{T}{T_{crit}} = \frac{273.15 + 600}{405.4} = 2.15\]
\[P_r = \displaystyle \frac{P}{P_{crit}} = \frac{0.5}{11.34} = 0.04\]
From Figure 3.2.3, the compressibility factor  ; therefore, ammonia can be treated as an ideal gas at the given condition. Note that the reduced temperature of ammonia is greater than 2 and the reduced pressure is very small, indicating the given state is far away from the critical point.
Calculate the specific volume of steam at 3 MPa, 350oC by using three methods: (1) superheated water vapour table, (2) ideal gas EOS, and (3) compressibility factor. How accurate is each of the methods?
Solution
Method 1: use the steam table.
From Table A2: P=3 MPa and T=350oC, therefore, v=0.09056 m3/kg
Method 2: use the ideal gas EOS alone
From Table G1: R=0.4615 kJ/kgK for steam.
\[\because Pv = RT\]

The relative error in comparison to method 1 is
\[error \% = \displaystyle\frac{| 0.09586 - 0.09056 |}{0.09056}\times100\% = 5.85\%\]
Method 3: use the ideal gas EOS corrected by the compressibility factor
From Table E1: Pcrit=22.06 MPa, Tcrit=647.1 K for water.
Calculate the reduced pressure and reduced temperature at the given condition:
\[P_r = \displaystyle\frac{P}{P_{crit}} = \displaystyle\frac{3}{22.06} = 0.136\]
\[T_r = \displaystyle\frac{T}{T_{crit}} = \displaystyle\frac{273.15 + 350}{647.1} = 0.963\]
Estimate the compressibility factor from Figure 3.2.3: 
Calculate the specific volume at the given condition by incorporating the compressibility factor
\[\because Pv = ZRT\]
The relative error in comparison to method 1 is
\[error \% = \displaystyle\frac{| 0.09011 - 0.09056 |}{0.09056}\times100\% = 0.497\%\]
Comment:
Method 1 gives the most accurate value for specific volume among the three methods, as the steam table is specific for water vapour at different pressures and temperatures. Method 2 assumes steam as an ideal gas. This method is easy to use but gives the least accurate result. Method 3, by correcting the ideal gas EOS with the compressibility factor, improves the accuracy of the calculation.
Query \(\PageIndex{1}\)
Media Attributions
- Lee-Kesler compressibility factor © Israel Urieli adapted by Diana Bairaktarova is licensed under a CC BY-NC-SA (Attribution NonCommercial ShareAlike) license