2.2: Transmission Line Characteristics
- Page ID
- 112853
\( \newcommand{\vecs}[1]{\overset { \scriptstyle \rightharpoonup} {\mathbf{#1}} } \)
\( \newcommand{\vecd}[1]{\overset{-\!-\!\rightharpoonup}{\vphantom{a}\smash {#1}}} \)
\( \newcommand{\dsum}{\displaystyle\sum\limits} \)
\( \newcommand{\dint}{\displaystyle\int\limits} \)
\( \newcommand{\dlim}{\displaystyle\lim\limits} \)
\( \newcommand{\id}{\mathrm{id}}\) \( \newcommand{\Span}{\mathrm{span}}\)
( \newcommand{\kernel}{\mathrm{null}\,}\) \( \newcommand{\range}{\mathrm{range}\,}\)
\( \newcommand{\RealPart}{\mathrm{Re}}\) \( \newcommand{\ImaginaryPart}{\mathrm{Im}}\)
\( \newcommand{\Argument}{\mathrm{Arg}}\) \( \newcommand{\norm}[1]{\| #1 \|}\)
\( \newcommand{\inner}[2]{\langle #1, #2 \rangle}\)
\( \newcommand{\Span}{\mathrm{span}}\)
\( \newcommand{\id}{\mathrm{id}}\)
\( \newcommand{\Span}{\mathrm{span}}\)
\( \newcommand{\kernel}{\mathrm{null}\,}\)
\( \newcommand{\range}{\mathrm{range}\,}\)
\( \newcommand{\RealPart}{\mathrm{Re}}\)
\( \newcommand{\ImaginaryPart}{\mathrm{Im}}\)
\( \newcommand{\Argument}{\mathrm{Arg}}\)
\( \newcommand{\norm}[1]{\| #1 \|}\)
\( \newcommand{\inner}[2]{\langle #1, #2 \rangle}\)
\( \newcommand{\Span}{\mathrm{span}}\) \( \newcommand{\AA}{\unicode[.8,0]{x212B}}\)
\( \newcommand{\vectorA}[1]{\vec{#1}} % arrow\)
\( \newcommand{\vectorAt}[1]{\vec{\text{#1}}} % arrow\)
\( \newcommand{\vectorB}[1]{\overset { \scriptstyle \rightharpoonup} {\mathbf{#1}} } \)
\( \newcommand{\vectorC}[1]{\textbf{#1}} \)
\( \newcommand{\vectorD}[1]{\overrightarrow{#1}} \)
\( \newcommand{\vectorDt}[1]{\overrightarrow{\text{#1}}} \)
\( \newcommand{\vectE}[1]{\overset{-\!-\!\rightharpoonup}{\vphantom{a}\smash{\mathbf {#1}}}} \)
\( \newcommand{\vecs}[1]{\overset { \scriptstyle \rightharpoonup} {\mathbf{#1}} } \)
\(\newcommand{\longvect}{\overrightarrow}\)
\( \newcommand{\vecd}[1]{\overset{-\!-\!\rightharpoonup}{\vphantom{a}\smash {#1}}} \)
\(\newcommand{\avec}{\mathbf a}\) \(\newcommand{\bvec}{\mathbf b}\) \(\newcommand{\cvec}{\mathbf c}\) \(\newcommand{\dvec}{\mathbf d}\) \(\newcommand{\dtil}{\widetilde{\mathbf d}}\) \(\newcommand{\evec}{\mathbf e}\) \(\newcommand{\fvec}{\mathbf f}\) \(\newcommand{\nvec}{\mathbf n}\) \(\newcommand{\pvec}{\mathbf p}\) \(\newcommand{\qvec}{\mathbf q}\) \(\newcommand{\svec}{\mathbf s}\) \(\newcommand{\tvec}{\mathbf t}\) \(\newcommand{\uvec}{\mathbf u}\) \(\newcommand{\vvec}{\mathbf v}\) \(\newcommand{\wvec}{\mathbf w}\) \(\newcommand{\xvec}{\mathbf x}\) \(\newcommand{\yvec}{\mathbf y}\) \(\newcommand{\zvec}{\mathbf z}\) \(\newcommand{\rvec}{\mathbf r}\) \(\newcommand{\mvec}{\mathbf m}\) \(\newcommand{\zerovec}{\mathbf 0}\) \(\newcommand{\onevec}{\mathbf 1}\) \(\newcommand{\real}{\mathbb R}\) \(\newcommand{\twovec}[2]{\left[\begin{array}{r}#1 \\ #2 \end{array}\right]}\) \(\newcommand{\ctwovec}[2]{\left[\begin{array}{c}#1 \\ #2 \end{array}\right]}\) \(\newcommand{\threevec}[3]{\left[\begin{array}{r}#1 \\ #2 \\ #3 \end{array}\right]}\) \(\newcommand{\cthreevec}[3]{\left[\begin{array}{c}#1 \\ #2 \\ #3 \end{array}\right]}\) \(\newcommand{\fourvec}[4]{\left[\begin{array}{r}#1 \\ #2 \\ #3 \\ #4 \end{array}\right]}\) \(\newcommand{\cfourvec}[4]{\left[\begin{array}{c}#1 \\ #2 \\ #3 \\ #4 \end{array}\right]}\) \(\newcommand{\fivevec}[5]{\left[\begin{array}{r}#1 \\ #2 \\ #3 \\ #4 \\ #5 \\ \end{array}\right]}\) \(\newcommand{\cfivevec}[5]{\left[\begin{array}{c}#1 \\ #2 \\ #3 \\ #4 \\ #5 \\ \end{array}\right]}\) \(\newcommand{\mattwo}[4]{\left[\begin{array}{rr}#1 \amp #2 \\ #3 \amp #4 \\ \end{array}\right]}\) \(\newcommand{\laspan}[1]{\text{Span}\{#1\}}\) \(\newcommand{\bcal}{\cal B}\) \(\newcommand{\ccal}{\cal C}\) \(\newcommand{\scal}{\cal S}\) \(\newcommand{\wcal}{\cal W}\) \(\newcommand{\ecal}{\cal E}\) \(\newcommand{\coords}[2]{\left\{#1\right\}_{#2}}\) \(\newcommand{\gray}[1]{\color{gray}{#1}}\) \(\newcommand{\lgray}[1]{\color{lightgray}{#1}}\) \(\newcommand{\rank}{\operatorname{rank}}\) \(\newcommand{\row}{\text{Row}}\) \(\newcommand{\col}{\text{Col}}\) \(\renewcommand{\row}{\text{Row}}\) \(\newcommand{\nul}{\text{Nul}}\) \(\newcommand{\var}{\text{Var}}\) \(\newcommand{\corr}{\text{corr}}\) \(\newcommand{\len}[1]{\left|#1\right|}\) \(\newcommand{\bbar}{\overline{\bvec}}\) \(\newcommand{\bhat}{\widehat{\bvec}}\) \(\newcommand{\bperp}{\bvec^\perp}\) \(\newcommand{\xhat}{\widehat{\xvec}}\) \(\newcommand{\vhat}{\widehat{\vvec}}\) \(\newcommand{\uhat}{\widehat{\uvec}}\) \(\newcommand{\what}{\widehat{\wvec}}\) \(\newcommand{\Sighat}{\widehat{\Sigma}}\) \(\newcommand{\lt}{<}\) \(\newcommand{\gt}{>}\) \(\newcommand{\amp}{&}\) \(\definecolor{fillinmathshade}{gray}{0.9}\)This section gives, without derivation the standard characteristics of transmission lines. The first section, Section \(\PageIndex{1}\), makes the argument that a circuit with resistors, inductors, and capacitors is a good model for a transmission line. The most important parameters that are derived from transmission line theory are given in Section \(\PageIndex{2}\). The dimensions of some of the quantities that appear in transmission line theory are discussed in Section \(\PageIndex{3}\). Section \(\PageIndex{4}\) summarizes the important parameters of a lossless line and then a particularly important line, the microstrip line, is considered in Section \(\PageIndex{5}\).
Transmission Line RLGC Model
Regardless of the actual structure, a segment of uniform transmission line (i.e., a line with constant cross section along its length) as shown in Figure \(\PageIndex{1}\)(a) can be modeled by the circuit shown in Figure \(\PageIndex{1}\)(b) with
\(\begin{array}{lr|l}{\text{Resistance along the line}}&{=R}&{}\\{\text{Inductance along the line}}&{=L}&{\text{all specified}}\\{\text{Conductance shunting the line}}&{=G}&{\text{per unit length}}\\{\text{Capacitance shunting the line}}&{=C}&{}\end{array}\)
\(R,\: L,\: G,\) and \(C\) are referred to as resistance, inductance, conductance, and capacitance per unit length. (Sometimes p.u.l. is used as shorthand for per unit length.) In the metric system, ohms per meter (\(\Omega\text{/m}\)), henries per meter (\(\text{H/m}\)), siemens per meter (\(\text{S/m}\)) and farads per meter (F/m), respectively, are used. The values of \(R,\: L,\: G,\) and \(C\) are affected by the geometry of the transmission line and by the electrical properties of the dielectrics and conductors. \(C\) describes the ability to store electrical energy and is mostly due to the properties of the dielectric. \(G\) describes loss in the dielectric which derives from conduction in the dielectric and from dielectric relaxation. Most microwave substrates have negligible conductivity so dielectric loss dominates. Dielectric relaxation loss results from the movement of charge centers which result in distortion of the dielectric lattice (if a crystal) or molecular structure. The periodic variation of the \(E\) field transfers energy from the EM field to mechanical vibrations. \(R\) is due to ohmic loss in the metal more than anything else. \(L\) describes the ability to store magnetic energy and is mostly a function of geometry, as most materials used with transmission lines have \(\mu_{r} = 1\) (so no more magnetic energy is stored than in a vacuum).
For most lines the effects due to \(L\) and \(C\) dominate because of the relatively low series resistance and shunt conductance. The propagation characteristics of the line are described by its loss-free, or lossless, equivalent line, although in practice some information about \(R\) or \(G\) is necessary to determine power losses. The lossless concept is just a useful and good approximation.

Figure \(\PageIndex{1}\): Transmission line segment: (a) of length \(\Delta z\); and (b) lumped element model.
Transmission Line Properties
The derivation of transmission line properties can be found here. In this section, the properties are given without derivation and some of their consequences are explored.
The following quantities are defined:
\[\begin{align}\label{eq:17}\text{Characteristic impedance:}& \quad Z_{0}=\sqrt{\frac{R+\jmath\omega L}{G+\jmath\omega C}} \\ \label{eq:18}\text{Propagation constant:}&\quad\gamma=\sqrt{(R+\jmath\omega L)(G+\jmath\omega C)}\\ \label{eq:19}\text{Attenuation constant:}& \quad\alpha =\Re \left\{\gamma\right\} \\ \label{eq:20}\text{Phase constant:}&\quad\beta =ℑ\left\{\gamma\right\} \\ \label{eq:21}\text{Wavenumber:}&\quad k=-\jmath\gamma \\ \label{eq:22}\text{Phase velocity:}&\quad v_{p}=\omega /\beta \\ \label{eq:23}\text{Wavelength:}&\quad\lambda =\frac{2\pi}{|\gamma |}=\frac{2\pi}{|k|} \end{align} \]
where \(\omega = 2\pi f\) is the radian frequency and \(f\) is the frequency with the SI units of hertz (\(\text{Hz}\)). The wavenumber \(k\) as defined here is used in electromagnetics and where wave propagation is concerned. Considering one of the traveling waves, the phase velocity refers to the apparent velocity of which a point of constant phase on the sinewave appears to move.
The important result here is that a voltage wave (and a current wave) can be defined on a transmission line. One more parameter needs to be introduced: the group velocity,
The symbol \(\partial\) means partial derivative (the derivative of a multi-variable function with respect to just one of the variables).
\[\label{eq:24}v_{g}=\frac{\partial\omega}{\partial\beta} \]
The group velocity is the velocity of a modulated waveform’s envelope and describes how fast information propagates. It is the velocity at which the energy (i.e. information) in the waveform moves. Thus group velocity can never be more than the speed of light in a vacuum, \(c\). Phase velocity, however, can be more than \(c\). If the speed at which information moves varies with frequency, then a signal such as a pulse will spread out. Such a line is said to have dispersion. For a lossless, dispersionless line, the group and phase velocity are the same. If the phase velocity is frequency independent, then \(\beta\) is linearly proportional to \(\omega\).
Electrical length is used in designs prior to establishing the physical length of a line. The electrical length is expressed either as a fraction of a wavelength or in degrees (or radians), where a wavelength corresponds to \(360^{\circ}\) (or \(2π\text{ radians}\)). If \(\ell\) is its physical length, the electrical length of the line in radians is \(\beta\ell\).
A transmission line is \(10\text{ cm}\) long and at the operating frequency the phase constant \(\beta\) is \(30\text{ rad/m}\). What is the electrical length of the line?
Solution
The physical length of the line is \(\ell = 10\text{ cm} = 0.1\text{ m}\). Then the electrical length of the line is \(\ell_{e} =\beta\ell = (30\text{ rad/m})\times 0.1\text{ m} = 3\text{ radians}\). The electrical length can also be expressed in terms of wavelength noting that \(360^{\circ}\) corresponds to \(2π\text{ radians}\), which also corresponds to \(\lambda\). Thus \(\ell_{e} = (3\text{ radians})=3\times 360/(2π) = 171.9^{\circ}\) or \(\ell_{e} = 3/(2π)\lambda = 0.477\lambda\).
A transmission line has the \(RLGC\) parameters \(R = 100\:\Omega\text{/m},\: L = 80\text{ nH/m},\: G = 1.6\text{ S/m}\), and \(C = 200\text{ pF/m}\). Consider a traveling wave at \(2\text{ GHz}\) on the line.
- What is the attenuation constant?
- What is the phase constant?
- What is the phase velocity?
- What is the characteristic impedance of the line?
- What is the group velocity?
Solution
- \(\alpha :\gamma =\alpha +\jmath\beta =\sqrt{(R+\jmath\omega L)(G+\jmath\omega C)};\quad\omega =12.57\cdot 10^{9}\text{ rad/s}\)
\[\gamma =\sqrt{(100+\jmath\omega\cdot 80\cdot 10^{-9})(1.6+\jmath\omega 200\times 10^{-12})}=(17.94+\jmath 51.85)\text{m}^{-1}\nonumber \]
\[\alpha =\Re\left\{\gamma\right\} =17.94\text{ Np/m}\nonumber \] - Phase constant: \(\beta =ℑ\left\{\gamma\right\} =51.85\text{ rad/m}\)
- Phase velocity:
\[v_{p}=\frac{\omega}{\beta}=\frac{2\pi f}{\beta}=\frac{12.57\times 10^{9}\text{rad}\cdot\text{s}^{-1}}{51.85\text{rad}\cdot\text{m}^{-1}}=2.42\times 10^{8}\text{ m/s}\nonumber \] - \(Z_{0}=(R+\jmath\omega L)/\gamma =(100+\jmath\omega\cdot 80\cdot 10^{-9})/(17.94+\jmath 51.85)=(17.9+\jmath 4.3)\Omega\)
Note also that \(Z_{0}=\sqrt{(R+\jmath\omega L)/(G+\jmath\omega C)}\), which yields the same answer. - Group velocity:
\[v_{g}=\frac{\partial\omega}{\partial\beta}|_{f=2\text{ GHz}}\nonumber \]
Numerical derivatives will be used, thus \(v_{g}=\Delta\omega /\Delta\beta\). Now \(\beta\) is already known at \(2\text{ GHz}\). At \(1.9\text{ GHz},\:\gamma =17.884+\jmath 49.397\text{ m}^{-1}\), and so \(\beta =49.397\text{ rad/m}\).
\[v_{g}=\frac{2\pi (2\text{ GHz}-1.9\text{ GHz})}{\beta (2\text{ GHz})-\beta (1.9\text{ GHz})}=\frac{2\pi (2-1.9)10^{9}\text{ Hz}}{(51.85-49.397)\text{ m}^{-1}}=2.563\times 10^{8}\text{ m/s}\nonumber \]
(Note that \(\text{Hz} = \text{s}^{-1}\). Note that \(v_{g}\neq= v_{p}\), and so the transmission line has dispersion.)
Dimensions of \(\gamma ,\alpha ,\) and \(\beta\)
The SI unit of \(\gamma\) are inverse meters (\(\text{m}^{−1}\)) and the attenuation constant, \(\alpha\), and the phase constant, \(\beta\), have, strictly speaking, the same units. However, the convention is to introduce the dimensionless quantities Neper and radian to convey additional information. Thus the attenuation constant \(\alpha\) has the units of Nepers per meter (\(\text{Np/m}\)) and the phase constant \(\beta\) has the units radians per meter (\(\text{rad/m}\)). The unit Neper comes from the name of the \(e (= 2.7182818284590452354\ldots )\) symbol (written in upright font and not italics since it is a constant), which is called the Neper.
The name for e derives from John Napier, who developed the theory of logarithms [2]. \(e\) is sometimes called Euler’s constant
The Neper is used in calculating transmission line signal levels, \(V(z) = V^{+}_{0}\exp\left(-\gamma z\right) + V^{+}_{0}\exp\left(\gamma z\right)\), where \(V^+\) and \(V^-\) indicate contributions from waves traveling from source to load and load to source. The attenuation and phase constants are often separated and then the attenuation constant describes the decrease in signal amplitude as the signal travels down a transmission line. So when \(\alpha\ell = 1\text{ Np}\), where \(\ell\) is the length of the line, the signal has decreased to \(1/e\) of its original value, and the power drops to \(1/e^{2}\) of its original value. The decrease in signal level represents loss and the units of decibels per meter (\(\text{dB/m}\)) are used with \(1\text{ Np} = 20 \log e = 8.6858896381\text{ dB}\). So expressing \(\alpha\) as \(1\text{ Np/m}\) is the same as saying that the attenuation loss is \(8.6859\text{ dB/m}\). To convert from \(\text{dB}\) to \(\text{Np}\) multiply by \(0.1151\). Thus \(\alpha = x\text{ dB/m} = x\times 0.1151\text{ Np/m}\).
In engineering \(\log x ≡ \log_{10} x\) and \(\ln x ≡ \log_{e} x\).
A line has an attenuation of \(10\text{ dB/m}\) and a phase constant of \(50\text{ radians/m}\) at \(2\text{ GHz}\).
- What is the complex propagation constant of the transmission line?
- If the capacitance of the line is \(100\text{ pF/m}\) and the conductive loss is zero (i.e., \(G = 0\)), what is the characteristic impedance of the line?
Solution
- \(\alpha |_{\text{Np}}=0.1151\times\alpha |_{\text{dB}}=0.1151\times (10\text{ dB/m})=1.151\text{ Np/m},\:\beta =50\text{ rad/m}\)
Propagation constant, \(\gamma =\alpha +\jmath\beta =(1.151+\jmath 50)\text{ m}^{-1}\) - \(\gamma =\sqrt{(R+\jmath\omega L)(G+\jmath\omega C)}\), and \(Z_{0}=\sqrt{(R+\jmath\omega L)/(G+\jmath\omega C)}\), therefore \(Z_{0}=\gamma /(G+\jmath\omega C);\: w=2\pi\cdot 2\times 10^{9}\text{ s}^{-1};\: G=0;\:C=100\times 10^{-12}\text{ F}\), so \(Z_{0}=39.8-\jmath 0.916\:\Omega\).
Lossless Transmission Line
If the conductor and dielectric are ideal (i.e., lossless), then R =0= G and the equations for the transmission line characteristics simplify. The transmission line parameters from Equations \(\eqref{eq:17}\) and \(\eqref{eq:18}\)-\(\eqref{eq:23}\) are then
\[\begin{align}\label{eq:25}&Z_{0}=\sqrt{\frac{L}{C}} \\ \label{eq:26} &\alpha =0\\ \label{eq:27}&\beta =\omega\sqrt{LC} \\ \label{eq:28} &v_{p}=1/\sqrt{LC} \\ \label{eq:29}&\lambda_{g}=\frac{2\pi}{\omega\sqrt{LC}}=\frac{v_{p}}{f} \end{align} \]
Microstrip Line
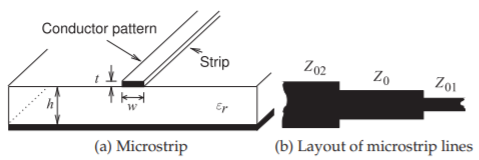
A microstrip line is shown in Figure \(\PageIndex{1}\)(a). This is a commonly used transmission line, as it can be cheaply fabricated using printed circuit board techniques. This line consists of a metal-backed substrate of relative permittivity \(\varepsilon_{r}\) on top of which is a metal strip. Above that is air.

Figure \(\PageIndex{1}\): Microstrip transmission line. The layout (or top) view is commonly used with circuit designs using microstrip. This is the pattern of the strip where (b) shows three lines of different width.

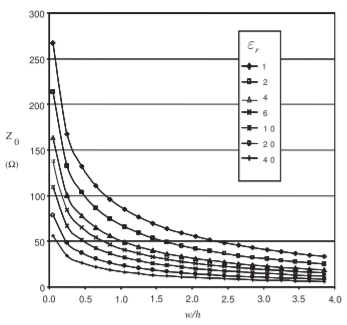
Figure \(\PageIndex{2}\): Dependence of \(Z_{0}\) of a microstrip line at \(1\text{ GHz}\) for various \(\varepsilon_{r}\) and aspect (\(w/h\)) ratios. Calculated using EM simulation.

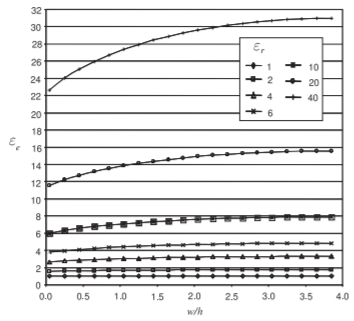
Figure \(\PageIndex{3}\): Dependence of effective relative permittivity \(\varepsilon_{e}\) of a microstrip line at \(1\text{ GHz}\) for various permittivities and aspect ratios (\(w/h\)).
The width of the strip determines the characteristic impedance of the line, and can be approximately calculated by:
\[Z_0 \approx \frac{\text{377}}{\sqrt{\epsilon_r}\left(\frac{w}{h} + 2\right)} \label{eq:microStripApprox} \]
Note that Equation \ref{eq:microStripApprox} is not accurate enough for use in high performance systems (see below), and more accurate analytical expressions have been found. However, for best performance, it is better to use a software tool to calculate the strip dimensions. The characteristic impedance of microstrip lines having various strip widths is shown in Figure \(\PageIndex{2}\) for several substrate permittivities. So the wider the strip and the higher the substrate permittivity, the lower the characteristic impedance of the line. The EM fields are partly in air and partly in the dielectric and an effective permittivity must be used when calculating the electrical length of the line. The results of field simulations of the effective permittivity of lines of various widths and with various substrate permittivities are shown in Figure \(\PageIndex{3}\), where it can be seen that the effective relative permittivity, \(\varepsilon_{e}\), increases for wide strips. This is because more of the EM field is in the substrate. Microstrip transmission line structures are often drawn showing just the layout of the strip, as shown in Figure \(\PageIndex{1}\)(b), where the three lines have different characteristic impedances.
In the script below, scikit-rf is used to calculate the impedance of a microstrip line and is compared with the impedance estimate from Equation \ref{eq:microStripApprox}. The third calculation is the loss after transmission over a 10 cm transmission line. Have a play with the script. What are the main differences between the approximation and the tool calculation? How does the loss vary with dielectric thickness? How can you minimize the loss at high frequencies (say 50 GHz)? Note you may have to run the script twice as it installs packages the first time, which may hide the output you are interested in.
Summary
The important takeaway from this section is that a signal moves on a transmission line as forward- and backward-traveling waves. The energy transferred is in the traveling waves. The total voltage and current at a point on the line is the sum of the traveling voltage and current waves, respectively, but the total voltage/current view is not sufficient to describe how a transmission line works. Transmission line theory is developed in terms of traveling voltages and current waves and these are akin to a one-dimensional form of Maxwell’s equations.


