7.1: Types of Process Diagrams
- Page ID
- 50195

\( \newcommand{\vecs}[1]{\overset { \scriptstyle \rightharpoonup} {\mathbf{#1}} } \) \( \newcommand{\vecd}[1]{\overset{-\!-\!\rightharpoonup}{\vphantom{a}\smash {#1}}} \)\(\newcommand{\id}{\mathrm{id}}\) \( \newcommand{\Span}{\mathrm{span}}\) \( \newcommand{\kernel}{\mathrm{null}\,}\) \( \newcommand{\range}{\mathrm{range}\,}\) \( \newcommand{\RealPart}{\mathrm{Re}}\) \( \newcommand{\ImaginaryPart}{\mathrm{Im}}\) \( \newcommand{\Argument}{\mathrm{Arg}}\) \( \newcommand{\norm}[1]{\| #1 \|}\) \( \newcommand{\inner}[2]{\langle #1, #2 \rangle}\) \( \newcommand{\Span}{\mathrm{span}}\) \(\newcommand{\id}{\mathrm{id}}\) \( \newcommand{\Span}{\mathrm{span}}\) \( \newcommand{\kernel}{\mathrm{null}\,}\) \( \newcommand{\range}{\mathrm{range}\,}\) \( \newcommand{\RealPart}{\mathrm{Re}}\) \( \newcommand{\ImaginaryPart}{\mathrm{Im}}\) \( \newcommand{\Argument}{\mathrm{Arg}}\) \( \newcommand{\norm}[1]{\| #1 \|}\) \( \newcommand{\inner}[2]{\langle #1, #2 \rangle}\) \( \newcommand{\Span}{\mathrm{span}}\)\(\newcommand{\AA}{\unicode[.8,0]{x212B}}\)
Different diagrams of processes are useful for different purposes. The four we use here are all recursive, meaning that a process may be represented in terms of other, more detailed processes of the same sort, interconnected. Conversely, two or more connected processes may be represented by a single higher-level process with some of the detailed information suppressed. The processes represented can be either deterministic (noiseless) or nondeterministic (noisy), and either lossless or lossy.
- Block Diagram: Figure 7.1 (previous page) is a block diagram. It shows how the processes are connected, but very little about how the processes achieve their purposes, or how the connections are made. It is useful for viewing the system at a highly abstract level. An interconnection in a block diagram can represent many bits.
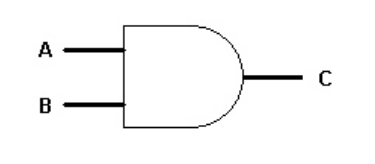
- Circuit Diagram: If the system is made of logic gates, a useful diagram is one showing such gates interconnected. For example, Figure 7.2 is an \(AND\) gate. Each input and output represents a wire with a single logic value, with, for example, a high voltage representing 1 and a low voltage 0. The number of possible bit patterns of a logic gate is greater than the number of physical wires; each wire could have two possible voltages, so for \(n\)-input gates there would be 2\(^n\) possible input states. Often, but not always, the components in logic circuits are deterministic.
- Probability Diagram: A process with \(n\) single-bit inputs and m single-bit outputs can be modeled by the probabilities relating the \(2^n\) possible input bit patterns and the 2\(^m\) possible output patterns. For example, Figure 7.3 (next page) shows a gate with two inputs (four bit patterns) and one output. An example of such a gate is the \(AND\) gate, and its probability model is shown in Figure 7.4. Probability diagrams are discussed further in Section 7.2.
- Information Diagram: A diagram that shows explicitly the information flow between processes is useful. In order to handle processes with noise or loss, the information associated with them can be shown. Information diagrams are discussed further in Section 7.6.